
Mathematics, 16.03.2022 14:00 arppy
Translation for the image:
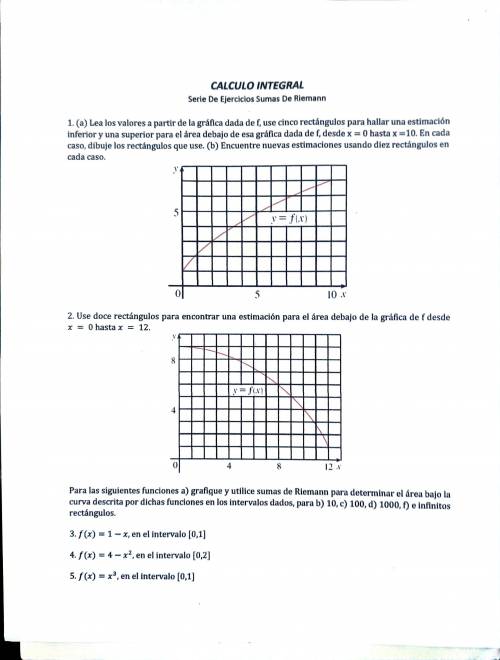
1. (a) Read the values from the graph given of  , use five rectangles to find an estimation inferior and superior for the area under the graph given of , from
  to
to  . In each case, draw the rectangles you use. (b) Find new estimations using ten rectangles in each case.
2. Use twelve rectangles to find an estimation for the area under 's graph from to  .
.
For the next functions a) graph and use Riemann sum to determine the area under the curve described for said functions in the given intervals, for b) 10, c) 100, d) 1000, f) and infinite rectangles.
3.  , interval
 ![[0,1]](/tpl/images/2695/5268/435e7.png)
4.  , interval
 ![[0,2]](/tpl/images/2695/5268/29791.png)
5.  , interval

Answers: 1


Other questions on the subject: Mathematics
Mathematics, 21.06.2019 22:30, fredvales19
What fraction is equivalent to 0.46464646··· a. 46⁄99 b. 46⁄999 c. 46⁄100 d. 23⁄50
Answers: 1
You know the right answer?
Translation for the image:
1. (a) Read the values from the graph given of , use five rectangles to...
Questions in other subjects:

History, 01.10.2019 00:00

History, 01.10.2019 00:00

Computers and Technology, 01.10.2019 00:00


Spanish, 01.10.2019 00:00


Social Studies, 01.10.2019 00:00


