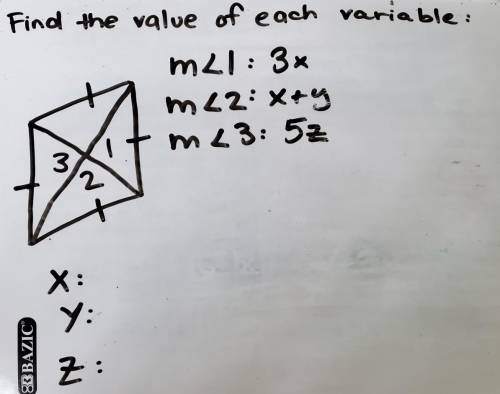
Find the value of each variable:
See image above ^^
...

Mathematics, 26.02.2022 20:00 bellamore
Find the value of each variable:
See image above ^^

Answers: 2


Other questions on the subject: Mathematics
Mathematics, 21.06.2019 12:30, giulianna41
Which of the following could be the graph of the equation y = -2x + 5
Answers: 2
Mathematics, 21.06.2019 20:30, chicalapingpon1938
Janet is rolling a number cube with the numbers one through six she record the numbers after each row if she rolls of keep 48 times how many times should she expect to roll a 4
Answers: 1
Mathematics, 21.06.2019 22:00, prishnasharma34
The two box p digram the two box plots show the data of the pitches thrown by two pitchers throughout the season. which statement is correct? check all that apply. pitcher 1 has a symmetric data set. pitcher 1 does not have a symmetric data set. pitcher 2 has a symmetric data set. pitcher 2 does not have a symmetric data set. pitcher 2 has the greater variation. ots represent the total number of touchdowns two quarterbacks threw in 10 seasons of play
Answers: 1
You know the right answer?
Questions in other subjects:
Mathematics, 04.06.2020 13:23


