Please help!!!
For each scenario below, choose the best graph.
(a) Tom walks from home to sc...

Mathematics, 15.02.2022 08:10 angellight4all
Please help!!!
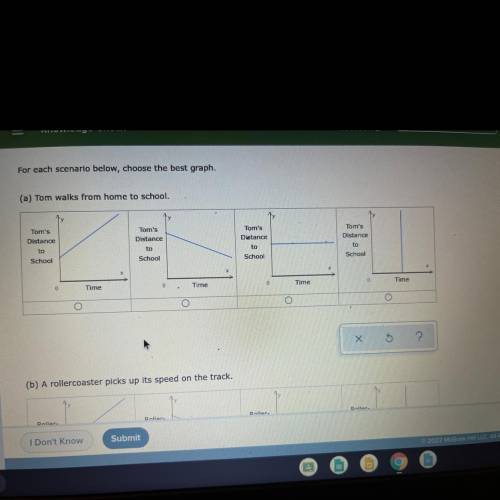
For each scenario below, choose the best graph.
(a) Tom walks from home to school.
Tom's
Distance
to
School
Tom's
Distance
to
School
Tom's
Distance
to
School
Tom's
Distance
to
School
Time
0
Time
0
Time
0
Time
O

Answers: 1


Other questions on the subject: Mathematics
Mathematics, 21.06.2019 16:10, DepressionCentral
Which of the following graphs represents the function f(x) = 2^x
Answers: 2
Mathematics, 21.06.2019 18:30, lealiastentz532542
The base of a triangle exceeds the height by 9 inches. if the area is 180 square inches, find the length of the base and the height of the triangle.
Answers: 1
Mathematics, 21.06.2019 19:00, Brendah4962
Solve the equation using the zero-product property. -3n(7n - 5) = 0 a. 0, -5/7 b. -1/3, -5/7 c. -1/3, 5/7 d. 0, 5/7
Answers: 2
Mathematics, 21.06.2019 21:30, ajm1132005
Questions 9-10. use the table of educational expenditures to answer the questions. k-12 education expenditures population indiana $9.97 billion 6.6 million illinois $28.54 billion 12.9 million kentucky $6.58 billion 4.4 million michigan $16.85 billion 9.9 million ohio $20.23 billion 11.6million 9. if the amount of k-12 education expenses in indiana were proportional to those in ohio, what would have been the expected value of k-12 expenditures in indiana? (give the answer in billions rounded to the nearest hundredth) 10. use the value of k-12 education expenditures in michigan as a proportion of the population in michigan to estimate what the value of k-12 education expenses would be in illinois. a) find the expected value of k-12 expenditures in illinois if illinois were proportional to michigan. (give the answer in billions rounded to the nearest hundredth) b) how does this compare to the actual value for k-12 expenditures in illinois? (lower, higher, same? )
Answers: 1
You know the right answer?
Questions in other subjects:

History, 24.10.2019 20:43

Social Studies, 24.10.2019 20:43

Mathematics, 24.10.2019 20:43
Social Studies, 24.10.2019 20:43
Mathematics, 24.10.2019 20:43


