
Mathematics, 12.02.2022 07:20 ecolifesfsu1263
Collect data from several fast-food chains on the number of fat calories and grams of saturated fat in menu items. A record at least 12 ordered pairs of (fat calories, grams of saturated fat). Organize your data in a table.
II. Make a scatter plot of the data on graph paper. Be sure to label the axes and use an appropriate title for the graph.
You may wish to use a graphing calculator, spread sheet, or other technology resource (such as the graphing utility link below) to aid you in graphing.
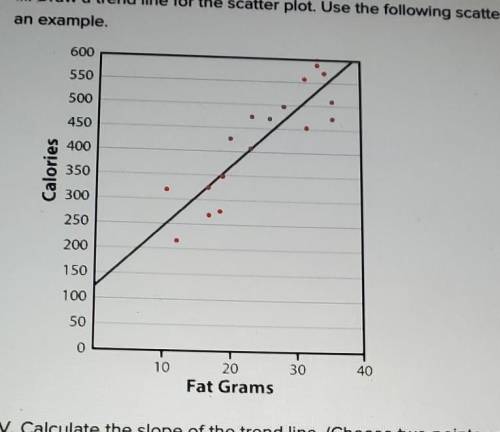
III. Draw a trend line for the scatter plot. Use the following scatter plot of the ordered pairs (fat grams, total calories) as an example.
IV. Calculate the slope of the trend line. (Choose two points on the line and find vertical change over horizontal change.)
Note: Graphing calculators and spread sheets have features with which to draw trend lines and determine the equation. You may choose to use one of these options. If you use technology, indicate what steps were taken to arrive at your equation.
V. Using the slope and y-intercept, write the equation of the trend line (y=mx+b).
VI. Choose a calories from fat value that is not in your collected data set and this is at least 10 fat calories away from any collected value. Use the equation calculated in step V to predict the number of fat grams in an item haveing that number of fat calories. Be sure to show your work.
VII. search for an item in a fast food menu having the same number of fat calories as the one you chose above . (if you cannot find the exact value ,get as close as u can.) Compare the calculated value frome step VI to this actual value. explain why or why not u would have expected your prediction calculated value to be closevto the actual value.

Answers: 2


Other questions on the subject: Mathematics
Mathematics, 21.06.2019 20:00, triggernugget05
Afootball is throw by a quarterback to a receiver
Answers: 2
Mathematics, 21.06.2019 21:30, drepeter86
50 people men and women were asked if they watched at least one sport on tv. 20 of the people surveyed are women, but only 9 of them watch at least one sport on tv. 16 of the men watch at least one sport on tv. make a a two-way table and a relative frequency table to represent the data.
Answers: 3
Mathematics, 22.06.2019 03:10, andrew2217
Kim took out a $55,000 loan for college she is borrowing money from 2 banks bank a charges an interest rate of 8% and b charges an interest rate of 11% after one year kim owes 5000 in interest how much money did she borrow from bank a.
Answers: 1
You know the right answer?
Collect data from several fast-food chains on the number of fat calories and grams of saturated fat...
Questions in other subjects:
Mathematics, 05.06.2020 13:57
Mathematics, 05.06.2020 13:57

Mathematics, 05.06.2020 13:57
Chemistry, 05.06.2020 13:57

History, 05.06.2020 13:57
Chemistry, 05.06.2020 13:57


