
Mathematics, 07.02.2022 07:40 maayajskkcc
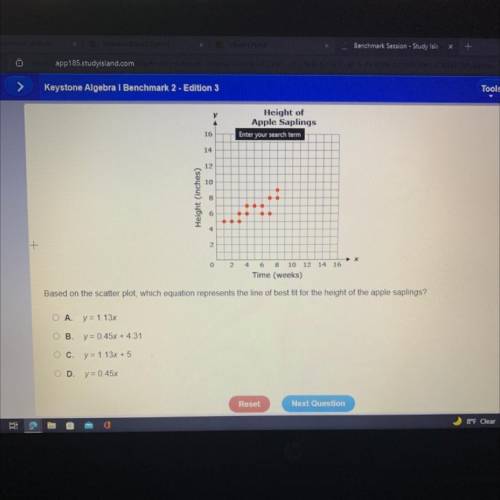
The scatter plot below shows the height (y), in inches of the apple saplings in David's orchard based on the time (x), in weeks,
after planting the saplings
Y
Height of
Apple Saplings
16
14
12
10
+
Height (inches)
8
6
4
2
X
0
2
4 6 8 10 12 14 16
Time (weeks)
Based on the scatter plot, which equation represents the line of best fit for the height of the apple saplings?

Answers: 1


Other questions on the subject: Mathematics
Mathematics, 21.06.2019 21:50, safiyyahrahman8937
Aparticular telephone number is used to receive both voice calls and fax messages. suppose that 25% of the incoming calls involve fax messages, and consider a sample of 25 incoming calls. (a) what is the expected number of calls among the 25 that involve a fax message?
Answers: 1
Mathematics, 21.06.2019 22:00, haleysmith8608
In dire need~! describe how to use area models to find the quotient 2/3 divided by 1/5. check your work by also finding the quotient 2/3 divided by 1/5 using numerical operations only.
Answers: 1
You know the right answer?
The scatter plot below shows the height (y), in inches of the apple saplings in David's orchard base...
Questions in other subjects:

History, 18.03.2021 02:30
Mathematics, 18.03.2021 02:30


