
Mathematics, 04.02.2022 14:50 alasia559
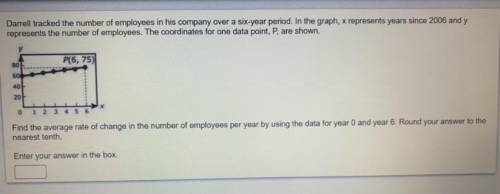
Darrell tracked the number of employees in his company over a six-year period. In the graph, x represents years since 2006 and y represents the number of employees. The coordinates for one data point, P, are shown.
Find the average rate of change in the number of employees per year by using the data for year 0 and year 6. Round your answer to the
nearest tenth

Answers: 1


Other questions on the subject: Mathematics
Mathematics, 21.06.2019 19:00, DestyHilBan1183
What are the solutions of the system? solve by graphing. y = -x^2 -6x - 7 y = 2
Answers: 2
Mathematics, 22.06.2019 01:30, lillianmitchell580
Write 37/22 as a decimal rounded to the nearest hundredth.
Answers: 2
Mathematics, 22.06.2019 01:30, musfirahkhurram
Sara is flying a kite at the park. the angle of elevation from sara to kite in the sky is 53° and the length of the string is 32 feet. of sara is 5 feet tall how far off the ground is the kite
Answers: 1
You know the right answer?
Darrell tracked the number of employees in his company over a six-year period. In the graph, x repre...
Questions in other subjects:


Mathematics, 18.05.2021 02:10

Chemistry, 18.05.2021 02:10
History, 18.05.2021 02:10
Mathematics, 18.05.2021 02:10
Mathematics, 18.05.2021 02:10
History, 18.05.2021 02:10


