
Mathematics, 28.01.2022 14:00 viktoria1198zz
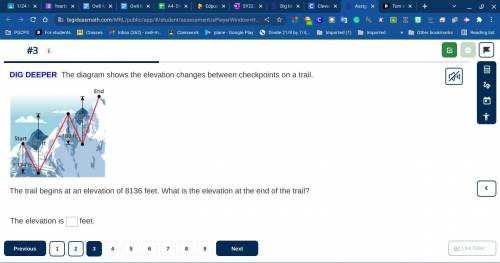
DIG DEEPER The diagram shows the elevation changes between checkpoints on a trail. A drawing shows the change in elevation between checkpoints on a mountain trail. From a point labeled start, the trail moves down to a point which is labeled negative 174 feet from the starting point. The trail then moves upward up to a point labeled 350 feet above the previous point. Next, the trail moves down to a point which is labeled negative 180 feet below the previous point. Then the trail moves up to a point labeled 282 feet above the previous point labeled end.

Answers: 2


Other questions on the subject: Mathematics
Mathematics, 21.06.2019 21:30, BARRION1981
Over the course of the school year, you keep track of how much snow falls on a given day and whether it was a snow day. your data indicates that of twenty-one days with less than three inches of snow, five were snow days, while of the eight days with more than three inches of snow, six were snow days. if all you know about a day is that it is snowing, what is the probability that it will be a snow day?
Answers: 1
You know the right answer?
DIG DEEPER The diagram shows the elevation changes between checkpoints on a trail.
A drawing shows...
Questions in other subjects:


Biology, 22.02.2021 04:10

English, 22.02.2021 04:10
Biology, 22.02.2021 04:10
Mathematics, 22.02.2021 04:10
Mathematics, 22.02.2021 04:10
English, 22.02.2021 04:10


