
Mathematics, 23.01.2022 15:40 autumnskye1
Would like scatter plot image with line of best fit on the plot
1.Which variable did you plot on the x-axis, and which variable did you plot on the y-axis? Explain why you assigned the variables in that way.
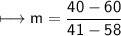
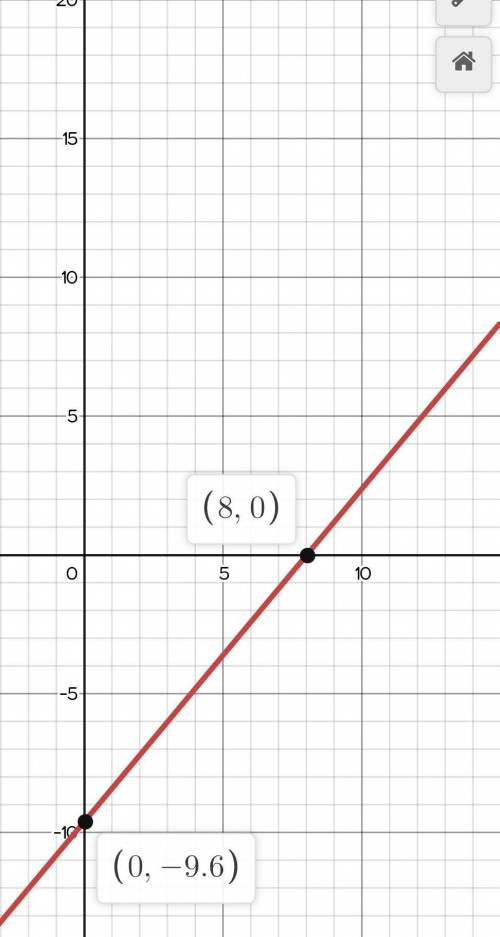
2.Write the equation of the line of best fit using the slope-intercept formula y = mx + b. Show all your work, including the points used to determine the slope and how the equation was determined.
3.What does the slope of the line represent within the context of your graph? What does the y-intercept represent?
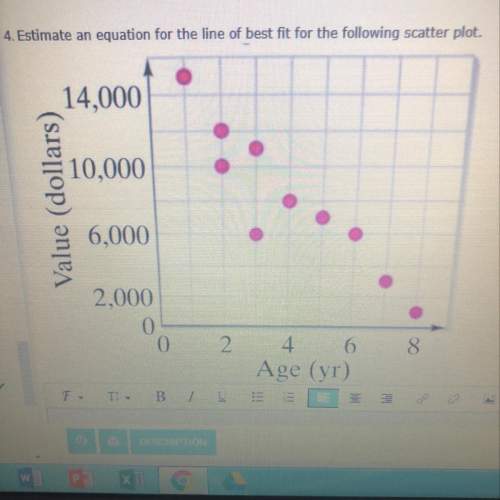
4.Test the residuals of two other points to determine how well the line of best fit models the data.
5.Use the line of best fit to help you to describe the data correlation.
6.Using the line of best fit that you found in Part Three, Question 2, approximate how tall is a person whose arm span is 66 inches?
7.According to your line of best fit, what is the arm span of a 74-inch-tall person?
Arm Span on Left, Height on Right
58 60
49 47
51 55
19 25
37 39
44 45
47 49
36 35
41 40
46 50
58 61
68 66

Answers: 1


Other questions on the subject: Mathematics
Mathematics, 21.06.2019 14:30, naenae6775
Acable company wants to provide cell phone service for residents on an island. the function for the cost of laying the cable from the island to the mainland is c(x)= 6.500 square root x2+4, where x represents the length of the cable in feet. what are the domain and range of the function? a) domain: all real numbers range: all real numbers greater than or equal to 17,000 b) domain: all real numbers greater than or equal to 0 range: all real numbers greater than or equal to 17,000 c) domain: all real numbers greater than or equal to 0 range: all real numbers greater than or equal to 13,000 d) domain: all real numbers greater than or equal to 13,000 range: all real numbers greater than or equal to 0
Answers: 3
Mathematics, 21.06.2019 17:00, ChooseHappy
One side of a rectangle is 7 feet shorter than seven times the other side. find the length of the shorter side if we also know that the perimeter of the rectangle is 306 feet.
Answers: 2
You know the right answer?
Would like scatter plot image with line of best fit on the plot
1.Which variable did you plot on t...
Questions in other subjects:
Mathematics, 29.01.2020 21:01

English, 29.01.2020 21:01


History, 29.01.2020 21:01
Mathematics, 29.01.2020 21:01
Mathematics, 29.01.2020 21:01


