
Mathematics, 15.01.2022 09:00 aylineorozco836
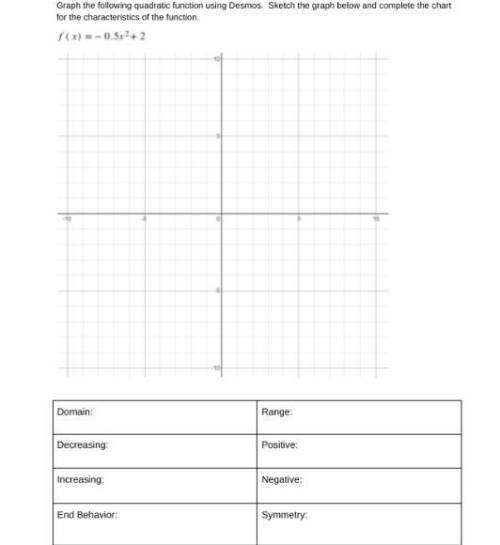
Hello today is my birthday and i would rlly ask for help please lend me a hand thxs its due ( i'm basically suppose to graph and fill the info below according to the graph thxs) if you have trouble seeing this and if you got insta(gram) lets dm i'll show the image more clear ! f(x)= - 0.5^2+2

Answers: 1


Other questions on the subject: Mathematics
Mathematics, 21.06.2019 19:50, jlankford148
A3-dimensional figure has a square base and 4 lateral faces that meet at a point. explain the difference between the cross sections when a slice is made perpendicular to the base through the vertex, and when a slice is made perpendicular to the base and not through the vertex
Answers: 2
Mathematics, 21.06.2019 23:20, galaxyomg661p0edpt
8litres of paint can cover 129.6 m². how much paint is required to paint an area of 243m²?
Answers: 3
Mathematics, 22.06.2019 02:30, misk980
Atrain traveled for 1.5 hours to the first station, stopped for 30 minutes, then traveled for 4 hours to the final station where it stopped for 1 hour. the total distance traveled is a function of time. which graph most accurately represents this scenario? a graph is shown with the x-axis labeled time (in hours) and the y-axis labeled total distance (in miles). the line begins at the origin and moves upward for 1.5 hours. the line then continues upward at a slow rate until 2 hours. from 2 to 6 hours, the line continues quickly upward. from 6 to 7 hours, it moves downward until it touches the x-axis a graph is shown with the axis labeled time (in hours) and the y axis labeled total distance (in miles). a line is shown beginning at the origin. the line moves upward until 1.5 hours, then is a horizontal line until 2 hours. the line moves quickly upward again until 6 hours, and then is horizontal until 7 hours a graph is shown with the axis labeled time (in hours) and the y-axis labeled total distance (in miles). the line begins at the y-axis where y equals 125. it is horizontal until 1.5 hours, then moves downward until 2 hours where it touches the x-axis. the line moves upward until 6 hours and then moves downward until 7 hours where it touches the x-axis a graph is shown with the axis labeled time (in hours) and the y-axis labeled total distance (in miles). the line begins at y equals 125 and is horizontal for 1.5 hours. the line moves downward until 2 hours, then back up until 5.5 hours. the line is horizontal from 5.5 to 7 hours
Answers: 1
You know the right answer?
Hello today is my birthday and i would rlly ask for help please lend me a hand thxs its due ( i'm ba...
Questions in other subjects:

History, 04.08.2019 13:00

Business, 04.08.2019 13:00

Biology, 04.08.2019 13:00
History, 04.08.2019 13:00
History, 04.08.2019 13:00

English, 04.08.2019 13:00

Computers and Technology, 04.08.2019 13:00


