
Mathematics, 11.01.2022 03:00 mia2286
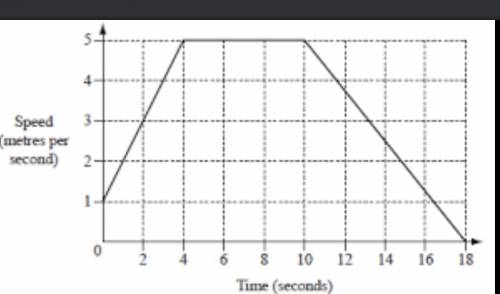
The diagram shows the speed time graph for the last 18 seconds of Roman cycle journey
a) calculate the deceleration
b) calculate the total distance Roman travels during the 18 seconds

Answers: 2


Other questions on the subject: Mathematics
Mathematics, 21.06.2019 13:30, christeinberg1
Abbey purchased a house using a fixed rate mortgage. the annual interest rate is 4.2% compounded monthly for 20 years. the mortgage amount is $235,000. what is the monthly payment on the mortgage? this isn't a multiple choice question have to show my work
Answers: 1
Mathematics, 21.06.2019 19:30, Jenan25
Consider this equation. |y + 6| = 2 what can be concluded of the equation? check all that apply. there will be one solution. there will be two solutions. the solution to –(y + 6) = 2 will be also be a solution to the given absolute value equation. the solution(s) will be the number(s) on the number line 2 units away from –6. the value of y must be positive since the variable is inside absolute value signs.
Answers: 1
Mathematics, 21.06.2019 23:30, JellalFernandes
Atruck can be rented from company a $50 a day plus $0.60 per mile. company b charges $20 a day plus $0.80 per mile to rent the same truck. find the number of miles in a day at which the rental costs for company a and company b are the same
Answers: 1
You know the right answer?
The diagram shows the speed time graph for the last 18 seconds of Roman cycle journey
a) calculate...
Questions in other subjects:

Chemistry, 23.08.2020 14:01


