NEED HELP
8. the table shows solutions for the inequality y<-x-1?
9. Which graph is...

Mathematics, 09.01.2022 07:50 B1GPAP1
NEED HELP
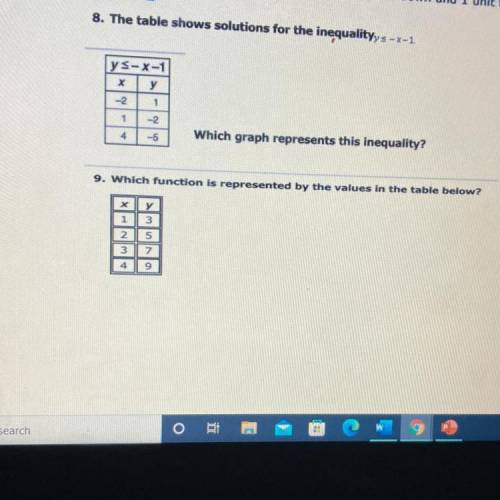
8. the table shows solutions for the inequality y<-x-1?
9. Which graph is represented by the values in the tables below?

Answers: 1


Other questions on the subject: Mathematics
Mathematics, 21.06.2019 17:30, apexdude2020
The swimming pool is open when the high temperature is higher than 20∘c. lainey tried to swim on monday and thursday (which was 33 days later). the pool was open on monday, but it was closed on thursday. the high temperature was 30 ∘c on monday, but decreased at a constant rate in the next 33 days. write an inequality to determine the rate of temperature decrease in degrees celsius per day, d, from monday to thursday.
Answers: 3
Mathematics, 21.06.2019 20:00, haleysmith8608
Given the graphed function below which of the following orders pairs are found on the inverse function
Answers: 1
Mathematics, 21.06.2019 22:00, jessejames48
The coordinates r(1, -3), s(3, -1) t(5, -7) form what type of polygon? a right triangle an acute triangle an equilateral triangle an obtuse triangle
Answers: 1
You know the right answer?
Questions in other subjects:
Mathematics, 17.10.2021 07:10
Mathematics, 17.10.2021 07:10

Mathematics, 17.10.2021 07:10


History, 17.10.2021 07:10


