Graph the trigonometric function.
y=-5/2 tan 3x
Start by drawing two consecutive asymptotes....

Mathematics, 07.01.2022 01:00 ripbobbyjackson6701
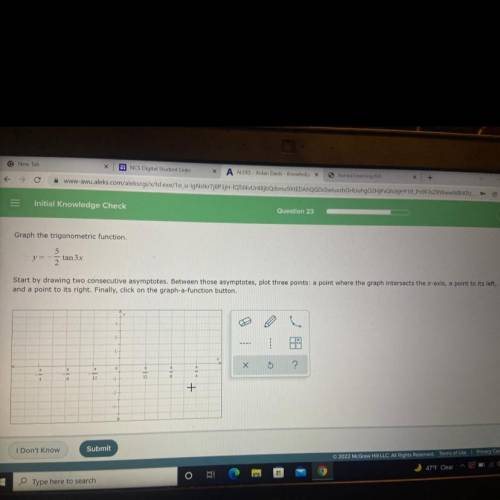
Graph the trigonometric function.
y=-5/2 tan 3x
Start by drawing two consecutive asymptotes. Between those asymptotes, plot three points: a point where the graph intersects the x-axis, a point to its left,
and a point to its right. Finally, click on the graph-a-function button.

Answers: 1


Other questions on the subject: Mathematics
Mathematics, 21.06.2019 16:50, joshsd8479
Which is a true statement comparing the graphs of x^2/6^2-y^2/8^2 = 1 and x^2/8^2-y^2/6^2 the foci of both graphs are the same points. the lengths of both transverse axes are the same. the directrices of = 1 are horizontal while the directrices of = 1 are vertical. the vertices of = 1 are on the y-axis while the vertices of = 1 are on the x-axis.
Answers: 2
Mathematics, 21.06.2019 18:00, xxaurorabluexx
Suppose you are going to graph the data in the table. minutes temperature (°c) 0 -2 1 1 2 3 3 4 4 5 5 -4 6 2 7 -3 what data should be represented on each axis, and what should the axis increments be? x-axis: minutes in increments of 1; y-axis: temperature in increments of 5 x-axis: temperature in increments of 5; y-axis: minutes in increments of 1 x-axis: minutes in increments of 1; y-axis: temperature in increments of 1 x-axis: temperature in increments of 1; y-axis: minutes in increments of 5
Answers: 2
You know the right answer?
Questions in other subjects:

History, 01.09.2019 02:50


English, 01.09.2019 02:50

Mathematics, 01.09.2019 02:50


