
Mathematics, 06.01.2022 15:10 TMeansStupidity
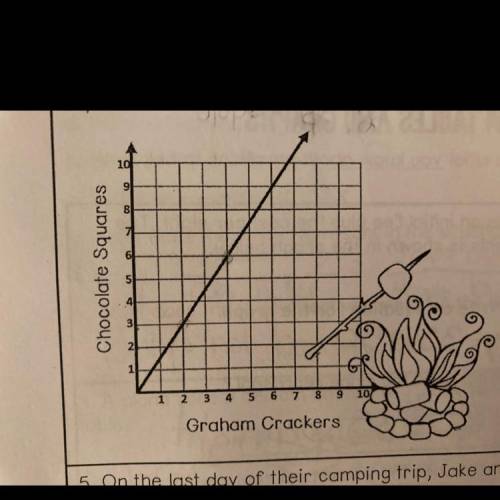
In the evenings, jake and his friends would cook out and make s’mores for dessert. the ratio of chocolate squares to graham crackers that they used is shown in the graph below.
a. Write and equation for the graph.
b. What does the slope represent?
c. What does the y-intercept represent?

Answers: 2


Other questions on the subject: Mathematics
Mathematics, 21.06.2019 14:00, hockeykid7583
The axis of symmetry for the graph of the function f(x)=1/4^2+bx +10 is x=6. what is the value of b?
Answers: 1
Mathematics, 21.06.2019 19:30, shanua
Needmax recorded the heights of 500 male humans. he found that the heights were normally distributed around a mean of 177 centimeters. which statements about max’s data must be true? a) the median of max’s data is 250 b) more than half of the data points max recorded were 177 centimeters. c) a data point chosen at random is as likely to be above the mean as it is to be below the mean. d) every height within three standard deviations of the mean is equally likely to be chosen if a data point is selected at random.
Answers: 2
You know the right answer?
In the evenings, jake and his friends would cook out and make s’mores for dessert. the ratio of choc...
Questions in other subjects:


English, 07.07.2019 10:00
Mathematics, 07.07.2019 10:00


