
Mathematics, 03.01.2022 01:30 nae9587
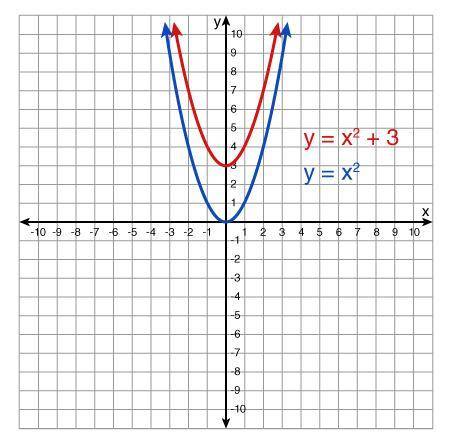
A quadratic function models the graph of a parabola. The quadratic functions, y = x2 and y = x2 + 3, are modeled in the graphs of the parabolas shown below.
Determine which situations best represent the scenario shown in the graph of the quadratic functions, y = x2 and y = x2 + 3. Select all that apply ( MULTIPLE CHOICE!! )
A) From x = -2 to x = 0, the average rate of change for both functions is negative.
B) For the quadratic function, y = x2, the coordinate (2, 3) is a solution to the equation of the function.
C) The quadratic function, y = x2 + 3, has an x-intercept at the origin.
D) The quadratic function, y = x2, has an x-intercept at the origin.
E) From x = -2 to x = 0, the average rate of change for both functions is positive.
D) For the quadratic function, y = x2 + 3, the coordinate (2, 7) is a solution to the equation of the function.

Answers: 1


Other questions on the subject: Mathematics
You know the right answer?
A quadratic function models the graph of a parabola. The quadratic functions, y = x2 and y = x2 + 3,...
Questions in other subjects:

English, 04.11.2020 02:40


Biology, 04.11.2020 02:40

Social Studies, 04.11.2020 02:40

Mathematics, 04.11.2020 02:40
Mathematics, 04.11.2020 02:40


