Mathematics, 02.01.2022 21:40 cravens511peeelg
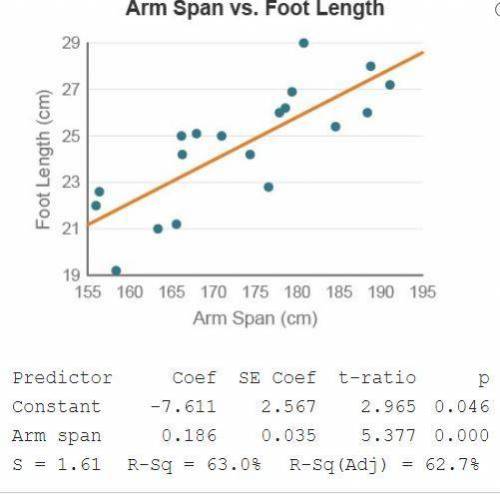
The arm span and foot length were measured (in centimeters) for each of the 19 students in a statistics class and displayed in the scatterplot. An analysis was completed and the computer output is shown.
Using the computer output, what is the predicted foot length for a student with an arm span of 160 cm?
5.79 cm
22.15 cm
29.76 cm
29.80 cm


Answers: 2


Other questions on the subject: Mathematics

Mathematics, 21.06.2019 20:00, gordon57
Someone answer asap for ! max recorded the heights of 500 male humans. he found that the heights were normally distributed around a mean of 177 centimeters. which statements about max’s data must be true? a. the median of max’s data is 250 b. more than half of the data points max recorded were 177 centimeters. c. a data point chosen at random is as likely to be above the mean as it is to be below the mean. d. every height within three standard deviations of the mean is equally likely to be chosen if a data point is selected at random.
Answers: 1

Mathematics, 21.06.2019 20:20, bbyjoker
Recall that the owner of a local health food store recently started a new ad campaign to attract more business and wants to know if average daily sales have increased. historically average daily sales were approximately $2,700. the upper bound of the 95% range of likely sample means for this one-sided test is approximately $2,843.44. if the owner took a random sample of forty-five days and found that daily average sales were now $2,984, what can she conclude at the 95% confidence level?
Answers: 1

Mathematics, 21.06.2019 20:30, cogger9348
3.17 scores on stats final. below are final exam scores of 20 introductory statistics students. 1 2 3 4 5 6 7 8 9 10 11 12 13 14 15 16 17 18 19 20 57, 66, 69, 71, 72, 73, 74, 77, 78, 78, 79, 79, 81, 81, 82, 83, 83, 88, 89, 94 (a) the mean score is 77.7 points. with a standard deviation of 8.44 points. use this information to determine if the scores approximately follow the 68-95-99.7% rule. (b) do these data appear to follow a normal distribution? explain your reasoning using the graphs provided below.
Answers: 1

Mathematics, 21.06.2019 23:00, Rogeartest4
Either enter an exact answer in terms of \piπ or use 3.143.14 for \piπ and enter your answer as a decimal.
Answers: 2
You know the right answer?
The arm span and foot length were measured (in centimeters) for each of the 19 students in a statist...
Questions in other subjects:

Health, 29.09.2019 04:00


French, 29.09.2019 04:00

Mathematics, 29.09.2019 04:00

Computers and Technology, 29.09.2019 04:00


Mathematics, 29.09.2019 04:00

Biology, 29.09.2019 04:00


