Mathematics, 30.12.2021 01:10 hdbug2025
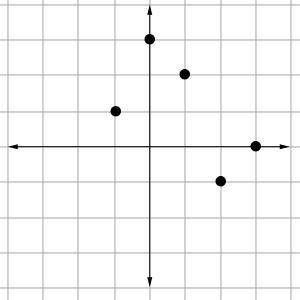
The graph of the function, B(x), is shown below. Determine the following values for the function:
B(x) = 0
B(x) = -1
B(x) = 2
Complete your work in the space provided.


Answers: 2


Other questions on the subject: Mathematics

Mathematics, 21.06.2019 14:10, jessicapbailey52
Which linear equations have an infinite number of solutions? check all that apply. (x – 3/7) = 2/7(3/2x – 9/14)8(x + 2) = 5x – 1412.3x – 18 = 3(–6 + 4.1x)(6x + 10) = 7(x – 2)4.2x – 3.5 = 2.1 (5x + 8)
Answers: 3

Mathematics, 21.06.2019 17:30, mduncan840
The marriott family bought a new apartment three years ago for $65,000. the apartment is now worth $86,515. assuming a steady rate of growth, what was the yearly rate of appreciation? what is the percent of the yearly rate of appreciation?
Answers: 1

Mathematics, 21.06.2019 21:30, ajm1132005
Questions 9-10. use the table of educational expenditures to answer the questions. k-12 education expenditures population indiana $9.97 billion 6.6 million illinois $28.54 billion 12.9 million kentucky $6.58 billion 4.4 million michigan $16.85 billion 9.9 million ohio $20.23 billion 11.6million 9. if the amount of k-12 education expenses in indiana were proportional to those in ohio, what would have been the expected value of k-12 expenditures in indiana? (give the answer in billions rounded to the nearest hundredth) 10. use the value of k-12 education expenditures in michigan as a proportion of the population in michigan to estimate what the value of k-12 education expenses would be in illinois. a) find the expected value of k-12 expenditures in illinois if illinois were proportional to michigan. (give the answer in billions rounded to the nearest hundredth) b) how does this compare to the actual value for k-12 expenditures in illinois? (lower, higher, same? )
Answers: 1

Mathematics, 21.06.2019 21:40, salinasroel22
In a survey of 1015 adults, a polling agency asked, "when you retire, do you think you will have enough money to live comfortably or not. of the 1015 surveyed, 534 stated that they were worried about having enough money to live comfortably in retirement. construct a 90% confidence interval for the proportion of adults who are worried about having enough money to live comfortably in retirement.
Answers: 3
You know the right answer?
The graph of the function, B(x), is shown below. Determine the following values for the function:...
Questions in other subjects:


Medicine, 19.07.2019 23:10

Mathematics, 19.07.2019 23:10


Computers and Technology, 19.07.2019 23:20

Engineering, 19.07.2019 23:20


