Consider the plot created from the residuals of a line of
best fit for a set of data.
Does t...

Mathematics, 23.12.2021 14:00 sara12340
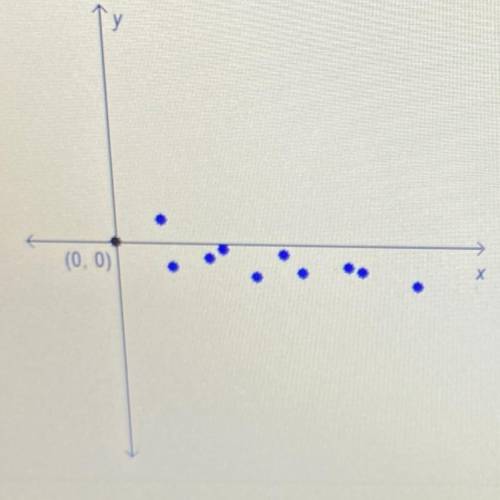
Consider the plot created from the residuals of a line of
best fit for a set of data.
Does the residual plot show that the line of best fit is
appropriate for the data?
O Yes, the points have no pattern.
O Yes, the points are evenly distributed about the x-
axis.
O No, the points are in a linear pattern.
O No, the points are in a curved pattern.
(0,0)

Answers: 3


Other questions on the subject: Mathematics
Mathematics, 21.06.2019 19:30, lovelyheart5337
In the given triangle, ∠aed ∼ ∠ abc, ad = 6.9, ae = 7.2, de = 5.2, and bc = 10.2. find the measure of bd and ce. round your answer to the nearest tenth.
Answers: 2
Mathematics, 21.06.2019 22:00, reesewaggoner8
Uestion 1(multiple choice worth 5 points) (05.02)alex wants to paint one side of his skateboard ramp with glow-in-the-dark paint, but he needs to know how much area he is painting. calculate the area of the isosceles trapezoid. isosceles trapezoid with top base 12 feet, bottom base of 18 feet, and height of 6 feet. 72 ft2 84 ft2 90 ft2 108 ft2
Answers: 1
You know the right answer?
Questions in other subjects:


Social Studies, 07.10.2021 14:00

Geography, 07.10.2021 14:00
Mathematics, 07.10.2021 14:00


Chemistry, 07.10.2021 14:00


