Please help
The graph of function f is shown.
(Picture added)
Function g is rep...

Mathematics, 20.12.2021 16:00 xlajbd
Please help
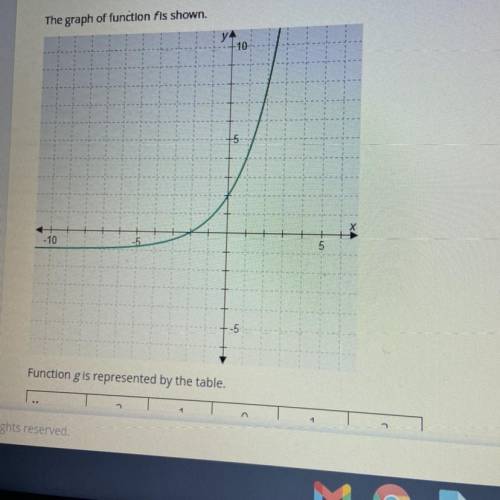
The graph of function f is shown.
(Picture added)
Function g is represented by the table.
X: -2 -1 0 1 2
g(x): -2/3 0 2 8 26
Which statement correctly compares the two functions?
A.) they have the same y-intercept and the same end behavior as x approaches ♾
B.) they have the same x-intercept and the same end behavior as x approaches ♾
C.) they have different x- and y-intercepts but the same end behavior as x approaches ♾
D.) they have the same x- and y-intercepts

Answers: 2


Other questions on the subject: Mathematics
Mathematics, 21.06.2019 18:40, Jonny13Diaz
What is the value of the expression below? 148+(-6)| + |– 35= 7|
Answers: 2
Mathematics, 22.06.2019 00:40, Hjackson24
What is the interquartile range (iqr) of the data set represented by this box plot?
Answers: 3
Mathematics, 22.06.2019 02:30, lauren21bunch
The distribution of a sample of the outside diameters of pvc pipes approximates a symmetrical, bell-shaped distribution. the arithmetic mean is 14.0 inches, and the standard deviation is 0.1 inches. about 68% of the outside diameters lie between what two amounts?
Answers: 1
Mathematics, 22.06.2019 03:00, crystalbyrd79p8imrx
What is the slopeof the live that passes through the points and (-2,-5) and (3,-1)
Answers: 2
You know the right answer?
Questions in other subjects:

Mathematics, 27.06.2019 06:00
Mathematics, 27.06.2019 06:00

Mathematics, 27.06.2019 06:00

Health, 27.06.2019 06:00
English, 27.06.2019 06:00


