
Mathematics, 19.12.2021 09:40 ayoismeisalex
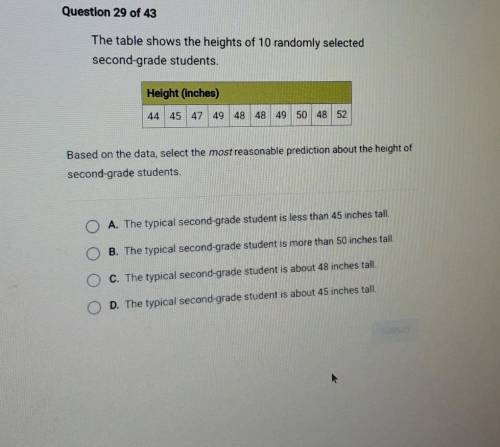
The table shows the heights of 10 randomly selected second-grade students. Height (inches) 44 | 45 | 47 | 49 | 48 | 48 | 49 | 50 | 48 52 Based on the data, select the most reasonable prediction about the height of second-grade students. A. The typical second-grade student is less than 45 inches tall. B. The typical second-grade student is more than 50 inches tall. C. The typical second-grade student is about 48 inches tall. 90 D. The typical second-grade student is about 45 inches tall. SUOT

Answers: 2


Other questions on the subject: Mathematics
Mathematics, 21.06.2019 20:00, Ap621765
In one day there are too high tides into low tides and equally spaced intervals the high tide is observed to be 6 feet above the average sea level after six hours passed a low tide occurs at 6 feet below the average sea level in this task you will model this occurrence using a trigonometric function by using x as a measurement of time assume the first high tide occurs at x=0. a. what are the independent and dependent variables? b. determine these key features of the function that models the tide: 1.amplitude 2.period 3.frequency 4.midline 5.vertical shift 6.phase shift c. create a trigonometric function that models the ocean tide for a period of 12 hours. d. what is the height of the tide after 93 hours?
Answers: 1
Mathematics, 22.06.2019 00:20, jayleneeeee
The police chief wants to know if the city’s african americans feel that the police are doing a good job. identify the management problem (i. e dependent variable) and identify the independent variable.
Answers: 1
You know the right answer?
The table shows the heights of 10 randomly selected second-grade students. Height (inches) 44 | 45 |...
Questions in other subjects:

History, 25.01.2021 20:00


English, 25.01.2021 20:00
Mathematics, 25.01.2021 20:00
Mathematics, 25.01.2021 20:00
Mathematics, 25.01.2021 20:00


