
Mathematics, 17.12.2021 09:00 loveyeti106838
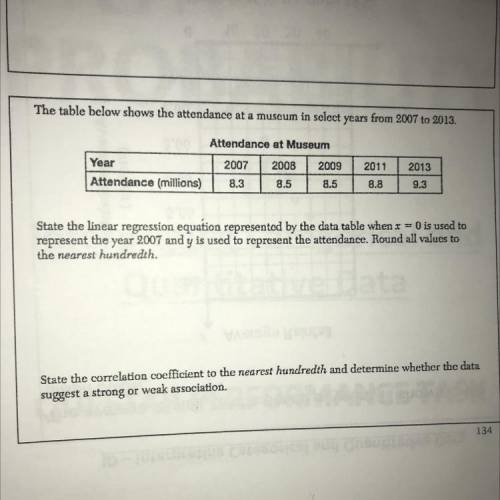
The table below shows the attendance at a muscum in select years from 2007 to 2013. State the linear regression equation represented by the data table when X = 0 is used to
represent the year 2007 and y is used to represent the attendance. Round all values to the nearest hundredth? &
State the correlation coefficient to the nearest hundredth and determine whether the data
suggest a strong or weak association?.

Answers: 2


Other questions on the subject: Mathematics
Mathematics, 22.06.2019 00:00, crazylogic963
Charlie is at an amusement park that has 18 different rides. each ride costs $1.75. the function c(r) = 1.75r represents the total amount of money that charlie will spend if he goes on r rides, but he never goes on the same one more than once. what domain and range are reasonable for the function?
Answers: 3
Mathematics, 22.06.2019 01:00, wedestttefera
Urgent? will give brainliest to the first correct answer what is the area of the figure?
Answers: 3
You know the right answer?
The table below shows the attendance at a muscum in select years from 2007 to 2013. State the linear...
Questions in other subjects:

Physics, 24.06.2019 18:30


English, 24.06.2019 18:30
Mathematics, 24.06.2019 18:30


