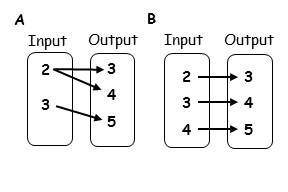
Which Mapping Diagram represents a function?
Group of answer choices
Mapping Diagram A...

Mathematics, 17.12.2021 06:50 hieth
Which Mapping Diagram represents a function?
Group of answer choices
Mapping Diagram A represents a function
Mapping Diagram B represents a function


Answers: 1


Other questions on the subject: Mathematics

Mathematics, 21.06.2019 20:30, destinyharris8502
I’m on question 7 it says a covered water tank is in the shape of a cylinder the tank has a 28 inch diameter and a height of 66 inches to the nearest square inch what is the surface area of the water tank
Answers: 2


Mathematics, 22.06.2019 01:30, joytheqt305
Arecent study focused on the number of times men and women who live alone buy take-out dinner in a month. assume that the distributions follow the normal probability distribution and the population standard deviations are equal. the information is summarized below. statistic men women sample mean 24.85 21.33 sample standard deviation 5.54 4.93 sample size 34 36 at the 0.01 significance level, is there a difference in the mean number of times men and women order take-out dinners in a month? state the decision rule for 0.01 significance level: h0: μmen= μwomen h1: μmen ≠ μwomen. (negative amounts should be indicated by a minus sign. round your answers to 3 decimal places.) compute the value of the test statistic. (round your answer to 3 decimal places.) what is your decision regarding the null hypothesis? what is the p-value? (round your answer to 3 decimal places.)
Answers: 1

Mathematics, 22.06.2019 01:50, issagirl05
Our star pitcher, foster enlight, can throw a pitch so fast that it gets to the catcher’s mitt before it leaves foster’s fingers! if the team wins a game then the probability that foster was pitching is 0.8 but only if foster had at least one day’s rest since his last pitching assignment. if foster does not have a day off and the team still wins, the probability that foster was pitching drops by half of what it was on the previous day. if the team wins three games in succession from the toronto tachyons and foster pitched in game #2, what is the probability that he pitched in one or more of the other games? (assume that foster did not pitch on the day before the first game of this three game series.)
Answers: 1
You know the right answer?
Questions in other subjects:


Mathematics, 21.09.2021 14:00

Mathematics, 21.09.2021 14:00


Physics, 21.09.2021 14:00

Chemistry, 21.09.2021 14:00

Mathematics, 21.09.2021 14:00


