
Mathematics, 15.12.2021 20:50 natashawetzel5961
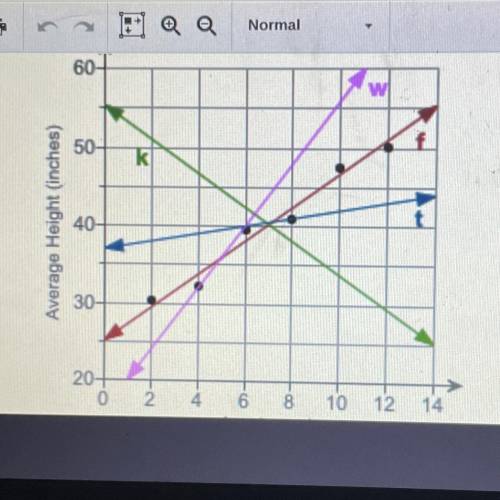
Plsss help it’s due tmr. The scatter plot shows the average height of people ages 2-12 in a certain
country. Which of the lines shown is a reasonable trend line for the scatter plot? Use
paper and pencil. How can a scatter plot have more than one linear model? How do
you decide which model to use? Explain your reasoning.

Answers: 2


Other questions on the subject: Mathematics
Mathematics, 21.06.2019 23:30, puppylover72
Find each value of the five-number summary for this set of data. [note: type your answers as numbers. do not round.] 46, 19, 38, 27, 12, 38, 51 minimum maximum median upper quartile lower quartile
Answers: 1
Mathematics, 22.06.2019 00:10, jocelynfray16
Change negative exponents to positive. then solve. round to four decimal places
Answers: 3
You know the right answer?
Plsss help it’s due tmr. The scatter plot shows the average height of people ages 2-12 in a certain...
Questions in other subjects:

History, 27.03.2021 05:50
Mathematics, 27.03.2021 05:50
Mathematics, 27.03.2021 05:50


Mathematics, 27.03.2021 05:50
Chemistry, 27.03.2021 05:50

Health, 27.03.2021 05:50


