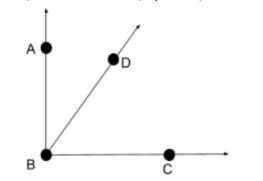
Given that ∠ABD is complementary with ∠DBC, ∠ABD = 2x+10 and ∠DBC = 10x-40:
a) Solve for x.
<...

Mathematics, 15.12.2021 08:40 heroicblad
Given that ∠ABD is complementary with ∠DBC, ∠ABD = 2x+10 and ∠DBC = 10x-40:
a) Solve for x.
b) Find m∠DBC

Answers: 3


Other questions on the subject: Mathematics
Mathematics, 21.06.2019 15:50, Kianna000
Dylan and dusty plan to take weekly surfing lessons together. if the 2-hour lessons are $20 per person and they plan to spend $100 each on new surfboards, what is the maximum number of lessons the two can take if the total amount spent for lessons and surfboards is at most $480?
Answers: 1
Mathematics, 21.06.2019 16:00, tdun7003
Find the area and perimeter of each composite figure. use 3.14 for π. round your answer to the nearest tenth. a square and a right triangle share a common side. image long description a 3-meter by 0.5-meter rectangle has triangles attached like wings to the 3-meter sides. the other two sides of both triangles measure 2.5 meters. the height of each triangle is 2 meters. a 6-inch by 4-inch rectangle has 2 half-circles attached like wings to the 6-inch sides. the radius of each half-circle is 3 inches. find the surface area and volume of each figure. use 3.14 for π. round your answer to the nearest tenth. a right circular cylinder has a base radius of 6 yards and a height of 20 yards. a rectangular prism has a base that is 9 centimeters long and 7 centimeters wide. the height is 2 centimeters. a rectangular prism has a base that measures 11 millimeters by 11 millimeters. the height is 11 millimeters.
Answers: 1
Mathematics, 22.06.2019 01:00, s27511583
The weight of 46 new patients of a clinic from the year 2018 are recorded and listed below. construct a frequency distribution, using 7 classes. then, draw a histogram, a frequency polygon, and an ogive for the data, using the relative information from the frequency table for each of the graphs. describe the shape of the histogram. data set: 130 192 145 97 100 122 210 132 107 95 210 128 193 208 118 196 130 178 187 240 90 126 98 194 115 212 110 225 187 133 220 218 110 104 201 120 183 124 261 270 108 160 203 210 191 180 1) complete the frequency distribution table below (add as many rows as needed): - class limits - class boundaries - midpoint - frequency - cumulative frequency 2) histogram 3) frequency polygon 4) ogive
Answers: 1
You know the right answer?
Questions in other subjects:

Chemistry, 10.03.2021 18:40
Mathematics, 10.03.2021 18:40
Chemistry, 10.03.2021 18:40
Mathematics, 10.03.2021 18:40

Mathematics, 10.03.2021 18:40

Biology, 10.03.2021 18:40


