
Mathematics, 15.12.2021 02:50 Jessieeeeey
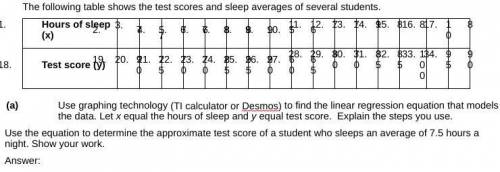
Use graphing technology (TI calculator or Desmos) to find the linear regression equation that models the data. Let x equal the hours of sleep and y equal test score. Explain the steps you use. Use the equation to determine the approximate test score of a student who sleeps an average of 7.5 hours a night. Show your work. (please no links or nonsense answers)

Answers: 1


Other questions on the subject: Mathematics
Mathematics, 21.06.2019 17:00, cordovatierra16
Which graph corresponds to the function f(x) = x2 + 4x – 1?
Answers: 1
Mathematics, 21.06.2019 22:10, markayla101326
In which direction does the left side of the graph of this function point? f(x) = 3x3 - x2 + 4x - 2
Answers: 2
You know the right answer?
Use graphing technology (TI calculator or Desmos) to find the linear regression equation that models...
Questions in other subjects:


Mathematics, 13.05.2021 01:00
Mathematics, 13.05.2021 01:00
Mathematics, 13.05.2021 01:00
Mathematics, 13.05.2021 01:00

Biology, 13.05.2021 01:00


