20 points
The graph below shows the water level in a tank being drained at a
constant rate....

Mathematics, 14.12.2021 08:30 rleiphart1
20 points
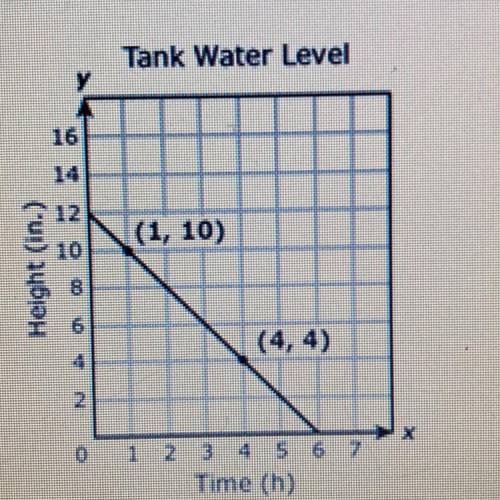
The graph below shows the water level in a tank being drained at a
constant rate. What does the X-intercept of the graph represent? *
Tank Water Level
у
16
14
12
(1, 10)
Height (in.)
(4,4)
4
2
0
1 2
3 4 5 6 7
Time (h)
The initial height of the water before any water drained out.
The number of hours it takes to completely empty the tank of water
The number of hours needed to drain 1 inch of water from the tank
The number of inches that the tank can hold

Answers: 3


Other questions on the subject: Mathematics
Mathematics, 21.06.2019 18:00, MayFlowers
Name each raycalculation tip: in ray "ab", a is the endpoint of the ray.
Answers: 1
Mathematics, 21.06.2019 19:00, Svetakotok
Identify the conclusion of the conditional statement. if you live in phoenix, then you live in arizona.
Answers: 1
Mathematics, 21.06.2019 22:30, brendaslater49p6ttxt
We have 339 ounces of jam to be divided up equally for 12 people how muny ounces will each person get
Answers: 1
Mathematics, 22.06.2019 03:30, akatherine1738
Given that the images represent 4 steps in the construction of a line segment congruent to a given line segment, which is step 3 in the construction?
Answers: 1
You know the right answer?
Questions in other subjects:
Mathematics, 08.02.2021 23:10

Biology, 08.02.2021 23:10
Mathematics, 08.02.2021 23:10

Advanced Placement (AP), 08.02.2021 23:10

English, 08.02.2021 23:10
Mathematics, 08.02.2021 23:10


History, 08.02.2021 23:10


