PLEASE HELP ASAPOP which inequality shown in the graph A. y>x2+ 5 B y> x2-5
...

Mathematics, 13.12.2021 22:30 jholland18
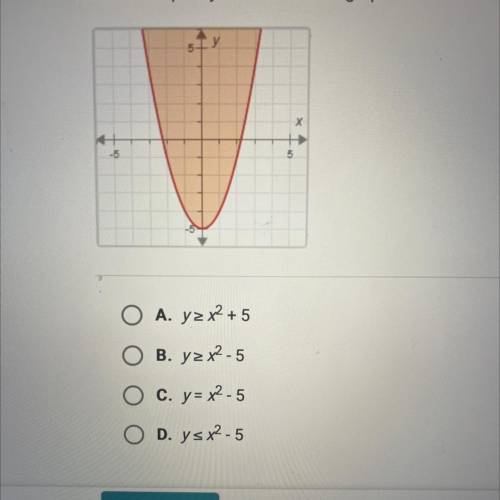
PLEASE HELP ASAPOP which inequality shown in the graph A. y>x2+ 5 B y> x2-5

Answers: 1


Other questions on the subject: Mathematics
Mathematics, 21.06.2019 22:00, foreverrocky12p2asun
Consider the triangle. which shows the order of the angles from smallest to largest? angle a, angle b, angle c angle b, angle a, angle c angle b, angle c, angle a angle c, angle a, angle b
Answers: 3
Mathematics, 22.06.2019 02:30, jujurocks10
Which problem would you use the following proportion to solve for? 24/x = 40/100 a. what is 40% of 24? b. what percent is 24 of 40? c. twenty-four is 40% of what number? d. forty percent of 24 is what number?
Answers: 1
Mathematics, 22.06.2019 03:10, krystalhurst97
Ofof is a ? a. (1, 2), (1,-2), (3, 2), (3, 4) b. (1,6), (2, ,9), (0,5) c. (0, 2), (2,3), (0, -2), (4,1) d. (2, 4), (0, 2), (2, - 4), (5,3)
Answers: 1
Mathematics, 22.06.2019 03:20, arangoaiden71
Aconcession manager at yankee stadium wants to know how temperature affects beer sales. she took a sample of 10 games and recorded the number of beers sold and the temperature in the middle of the game. temperature 80 68 78 79 87 74 86 92 77 84 number of beers 20533 1439 13829 21286 30985 17187 30240 87596 9610 28742 a. draw a scatter plot of the data. b. the manager estimates the regression equation to be: numberofbeers = −100, 678 + 1, 513 ∗ temperature draw this on your scatter plot. c. for one of the estimated points, indicate the residual with ei . d. for that same point, indicate what part of the variation is explained by the model with ˆyi − y¯.
Answers: 2
You know the right answer?
Questions in other subjects:
Mathematics, 10.11.2020 01:00

English, 10.11.2020 01:00

Chemistry, 10.11.2020 01:00

Mathematics, 10.11.2020 01:00


