
Mathematics, 13.12.2021 07:10 aidenmanpig
POSSIBLE POINTS 33 33
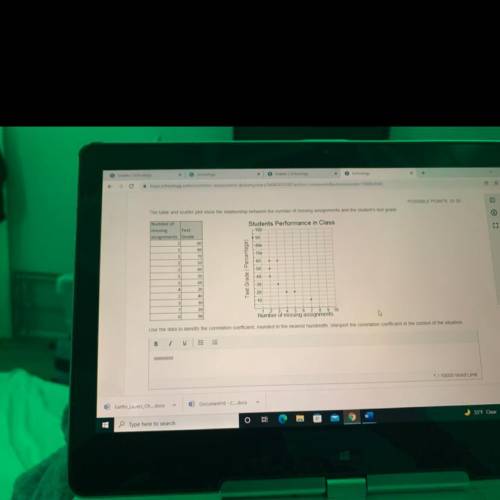
The table and scatter plot show the relationship between the number of missing assignments and the student's test grade
Students Performance in Class
100
90
-80-
-70
-60
Number of
missing
Test
assignments Grade
2
60
1
80
1
70
2 50
2
60
5
20
3
60
4
20
2
40
3 30
7
20
0
90
Test Grade (Percentage)
50
-40
30
20
10
1 3 4 5 6 7 8 10
Number of missing assignments
Use the data to identify the correlation coefficient, rounded to the nearest hundredth. Interpret the correlation coefficient in the context of the situation,
B
1
IC
iii
TII

Answers: 3


Other questions on the subject: Mathematics
Mathematics, 21.06.2019 19:30, indiaseel2744
Suppose i pick a jelly bean at random from a box containing one red and eleven blue ones. i record the color and put the jelly bean back in the box. if i do this three times, what is the probability of getting a blue jelly bean each time? (round your answer to three decimal places.)
Answers: 1
Mathematics, 22.06.2019 01:30, jjimenez0276
Talia took the bus from her home to the bank and then walked back to her home along the same route. the bus traveled at an average speed of 40 km/h and she walked at an average speed of 5 km/h. to determine the time, x, that it took talia to walk home, she used the equation 40(0.9 – x) = 5x. the time of trip 2 is hours. the distance of trip 1 is km.
Answers: 1
You know the right answer?
POSSIBLE POINTS 33 33
The table and scatter plot show the relationship between the number of missi...
Questions in other subjects:
Mathematics, 07.12.2021 06:50
Mathematics, 07.12.2021 06:50

English, 07.12.2021 06:50
Mathematics, 07.12.2021 06:50


Physics, 07.12.2021 06:50

Chemistry, 07.12.2021 06:50


