
Mathematics, 10.12.2021 01:20 yesenia1162
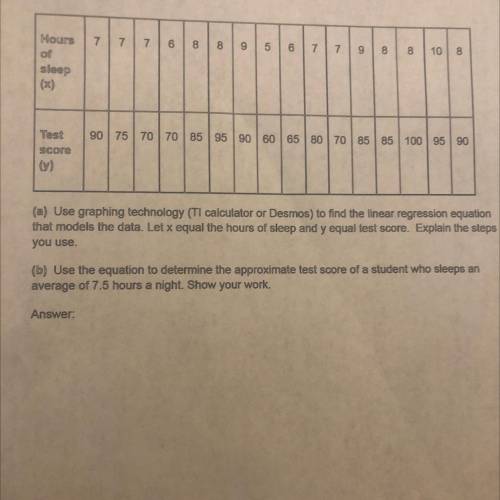
the following table shows the test scores and sleep averages of several students. hours of sleep (x) 7 7 7 6 8 8 9 5 6 7 7 9 8 8 10 8 test score (y) 90 75 70 70 85 95 90 60 65 80 70 85 85 100 95 90 (a) use graphing technology (ti calculator or desmos) to find the linear regression equation that models the data. let x equal the hours of sleep and y equal test score. explain the steps you use. (b) use the equation to determine the approximate test score of a student who sleeps an average of 7.5 hours a night. show your work

Answers: 3


Other questions on the subject: Mathematics
Mathematics, 21.06.2019 16:00, jasminemarie610
Drag the tiles to the correct boxes to complete the pairs. not all tiles will be used. the heights of the girls in an advanced swimming course are 55, 60, 59, 52, 65, 66, 62, and 65 inches. match the measures of this data with their values.
Answers: 1
You know the right answer?
the following table shows the test scores and sleep averages of several students. hours of sleep (x)...
Questions in other subjects:

History, 17.10.2019 15:10
Mathematics, 17.10.2019 15:10

Geography, 17.10.2019 15:10

Social Studies, 17.10.2019 15:10
Mathematics, 17.10.2019 15:10


