
Mathematics, 10.12.2021 01:00 QueenFlowerCrown98
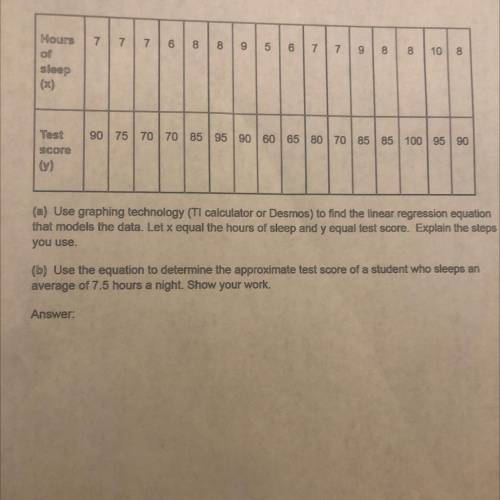
the following table shows the test scores and sleep averages of several students. hours of sleep (x) 7 7 7 6 8 8 9 5 6 7 7 9 8 8 10 8 test score (y) 90 75 70 70 85 95 90 60 65 80 70 85 85 100 95 90 (a) use graphing technology (ti calculator or desmos) to find the linear regression equation that models the data. let x equal the hours of sleep and y equal test score. explain the steps you use. (b) use the equation to determine the approximate test score of a student who sleeps an average of 7.5 hours a night. show your work

Answers: 1


Other questions on the subject: Mathematics
Mathematics, 21.06.2019 21:00, mawawakaiii
Asequence has its first term equal to 4, and each term of the sequence is obtained by adding 2 to the previous term. if f(n) represents the nth term of the sequence, which of the following recursive functions best defines this sequence? (1 point) f(1) = 2 and f(n) = f(n − 1) + 4; n > 1 f(1) = 4 and f(n) = f(n − 1) + 2n; n > 1 f(1) = 2 and f(n) = f(n − 1) + 4n; n > 1 f(1) = 4 and f(n) = f(n − 1) + 2; n > 1 i will award !
Answers: 1
Mathematics, 22.06.2019 01:30, reneebrown017
Use the given degree of confidence and sample data to construct a confidence interval for the population mean mu . assume that the population has a normal distribution. a laboratory tested twelve chicken eggs and found that the mean amount of cholesterol was 185 milligrams with sequals 17.6 milligrams. a confidence interval of 173.8 mgless than muless than 196.2 mg is constructed for the true mean cholesterol content of all such eggs. it was assumed that the population has a normal distribution. what confidence level does this interval represent?
Answers: 1
You know the right answer?
the following table shows the test scores and sleep averages of several students. hours of sleep (x)...
Questions in other subjects:

English, 05.05.2020 17:18

Mathematics, 05.05.2020 17:18


