
Mathematics, 03.12.2021 14:00 hermine40
Can I please get help in this percent prediction portfolio!
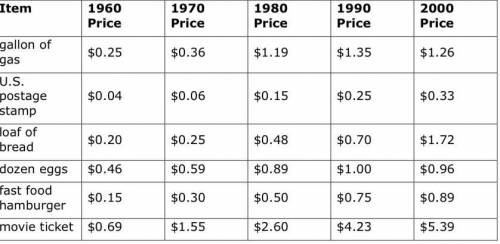
Choose one item of interest to you in the Historical Pricing Chart on the next page.
Calculate the percent of change of the item's price each decade, and use your results to determine the average rate of change from 1960–2000.
Comment on the trend in your item’s percent of increases.
Go shopping! Find the average current price of your item online, in the newspaper, or locally by looking at the price when you go to the store in the next day or two. Does the current price match the trend from 1960–2000 that you identified? Explain your thinking.
Create a line graph or other visual model to show the pricing trend. Be sure to include the current price in your model.
Predict the item's price at a future date. Use your calculations and visual model to justify your prediction.
Organize your analysis, prediction, explanations, and visual model in a brief news article. Your completed article will be submitted as your portfolio assessment.
Please explain the answer too! No rush please take your time!! Thank you

Answers: 2


Other questions on the subject: Mathematics
Mathematics, 21.06.2019 22:00, joelpimentel
3women sell hats at a craft fair weekly. the money they make at the fair is split into categories. 9% goes to pay taxes. $55 goes to pay rent for the space they sell in. the rest is split between the women. if the group make $706 at the fair, how much does each women get paid once the money is divided
Answers: 1
Mathematics, 22.06.2019 00:30, sanfordl
1. according to the internal revenue service, the mean tax refund for the year 2007 was $2,708. assume the standard deviation is $650 and that the amounts refunded follow a normal probability distribution. a. what percent of the refunds are more than $3,000? b. what percent of the refunds are more than $3,000 but less than $4,000? c. what percent of the refunds are less than $2,000?
Answers: 2
Mathematics, 22.06.2019 00:50, sharonsmailbagot6uas
After reading 80% of her e-mails in her inbox, danette still has m unread e-mails. which of the following expressions could represent the number of e-mails danette had in her inbox before she started reading? choose 2 answers: (choice a) 5m (choice b) 1.8m (choice c) 80m (choice d) m/0.8 (choice e) m/1−0.8
Answers: 1
Mathematics, 22.06.2019 01:50, isabelperez063
:i need some real : a store sells shirts to the public at one pricing scale and wholesale at another pricing scale. the tables below describe the cost, y, of x shirts. (after tables) how do the slopes of the lines created by each table compare? the slope of the public table is 3/4 of the slope of the wholesale table. the slope of the wholesale table is 3/4 of the slope of the public table. the slope of the public table is 12 times greater than the slope of the wholesale table. the slope of the wholesale table is 12 times greater than the slope of the public table.
Answers: 3
You know the right answer?
Can I please get help in this percent prediction portfolio!
Choose one item of interest to you in...
Questions in other subjects:

Health, 04.07.2019 08:30
Mathematics, 04.07.2019 08:30


