
Mathematics, 03.12.2021 07:30 freemanjskg
Problem 3-66
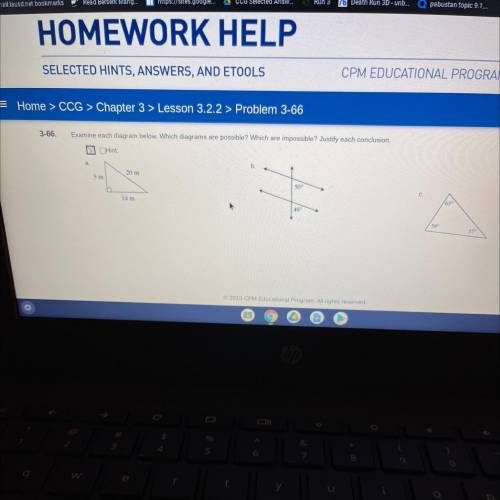
Examine each diagram below. Which diagrams are possible? Which are impossible? Justify each conclusion
Hint:

Answers: 2


Other questions on the subject: Mathematics
Mathematics, 21.06.2019 21:10, linettepizarro1233
See attachment below and find the equivalent of tan(∠qsr)
Answers: 3
Mathematics, 21.06.2019 22:00, prishnasharma34
The two box p digram the two box plots show the data of the pitches thrown by two pitchers throughout the season. which statement is correct? check all that apply. pitcher 1 has a symmetric data set. pitcher 1 does not have a symmetric data set. pitcher 2 has a symmetric data set. pitcher 2 does not have a symmetric data set. pitcher 2 has the greater variation. ots represent the total number of touchdowns two quarterbacks threw in 10 seasons of play
Answers: 1
Mathematics, 21.06.2019 23:30, hntnhtthnyt
Kerion has a beaded necklace business. she can make 12 necklaces is 2 hours. how long will it take her to make 9 necklaces?
Answers: 1
You know the right answer?
Problem 3-66
Examine each diagram below. Which diagrams are possible? Which are impossible? Justif...
Questions in other subjects:


Mathematics, 06.07.2019 12:30
Mathematics, 06.07.2019 12:30


History, 06.07.2019 12:30
English, 06.07.2019 12:30

Chemistry, 06.07.2019 12:40


