
Mathematics, 02.12.2021 05:30 Geo777
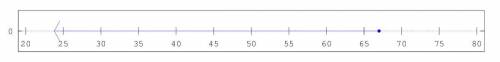
The stock market price of Techron Inc for a particular day is represented by the number line below. Which inequality represents the change in stock market price, m, of Techron Inc?

Answers: 2


Other questions on the subject: Mathematics
Mathematics, 22.06.2019 00:50, lorraneb31
C. using a standard deck of 52 cards, the probability of selecting a 4 of diamonds or a 4 of hearts is an example of a mutually exclusive event. true of false
Answers: 1
You know the right answer?
The stock market price of Techron Inc for a particular day is represented by the number line below....
Questions in other subjects:
Mathematics, 27.03.2020 22:13
Mathematics, 27.03.2020 22:13
Mathematics, 27.03.2020 22:13


Mathematics, 27.03.2020 22:13

History, 27.03.2020 22:13


