
Mathematics, 02.12.2021 04:50 adantrujillo1234
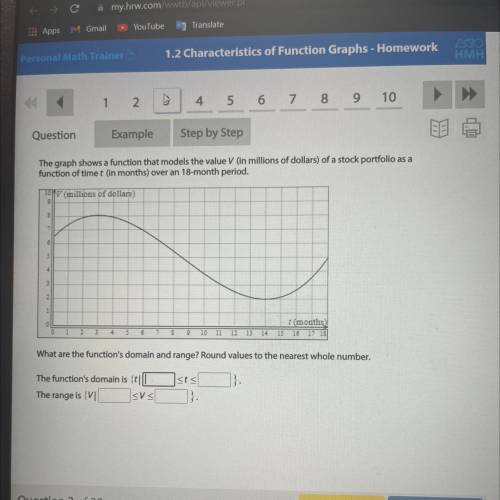
The graph shows a function that models the value V (in millions of dollars) of a stock portfolio as a
function of time t (in months) over an 18-month period.
101V (millions of dollars)
2
1 (months)
9 10 11 12 13 14 15 16 17 18
What are the function's domain and range? Round values to the nearest whole number.
1.
The function's domain is {t||
The range is {VIL <<

Answers: 2


Other questions on the subject: Mathematics
Mathematics, 21.06.2019 14:00, etxchrissy
Which graph represents the solution of the inequality?
Answers: 1
Mathematics, 22.06.2019 03:00, jess6142
Aboat has a speed of 9 mph in calm water. it takes the boat 4 hours to travel upstream but only 2 hours to travel the same distance downstream. which equation can be used to find c, the speed of the current? 2(9 – c) = 4(9 + c) 9 + c = 4(9 – c) 9 – c = 2(9 + c) 4(9 – c) = 2(9 + c)
Answers: 3
You know the right answer?
The graph shows a function that models the value V (in millions of dollars) of a stock portfolio as...
Questions in other subjects:

Computers and Technology, 10.03.2021 23:50


Mathematics, 10.03.2021 23:50
Mathematics, 10.03.2021 23:50
Engineering, 10.03.2021 23:50
Mathematics, 10.03.2021 23:50
Mathematics, 10.03.2021 23:50


