
Mathematics, 02.12.2021 01:10 KitKat22Rose9
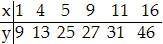
Construct a scatterplot and identify the mathematical model that best fits the data. Assume that the model is to be used only for the scope of the given data and consider only linear, quadratic, logarithmic, exponential, and power models. Use a calculator or computer to obtain the regression equation of the model that best fits the data. You may need to fit several models and compare the values of R2.
y = 8.14x0.58
y = 7.04 + 2.36x
y = 0.01x2 + 2.19x + 7.53
y = 4.40 + 12.02 ln x

Answers: 1


Other questions on the subject: Mathematics
Mathematics, 21.06.2019 22:30, campilk5
Sketch the vector field vector f( vector r ) = 8vector r in the xy-plane. select all that apply. the length of each vector is 8. the lengths of the vectors decrease as you move away from the origin. all the vectors point away from the origin. all the vectors point in the same direction. all the vectors point towards the origin. the lengths of the vectors increase as you move away from the origin.
Answers: 2
Mathematics, 21.06.2019 23:30, isabel2417
Which equation represents a direct linear variationa. y=x2b. y=2/5xc. y=1/xd. y=x+3
Answers: 3
Mathematics, 22.06.2019 01:00, ryantrajean7
The collection of beautiful oil paintings currently on display at an art gallery well defined; set not well defined; not a set
Answers: 2
You know the right answer?
Construct a scatterplot and identify the mathematical model that best fits the data. Assume that the...
Questions in other subjects:


Social Studies, 09.12.2021 15:10


