
Mathematics, 30.11.2021 23:20 leriscepowell3654
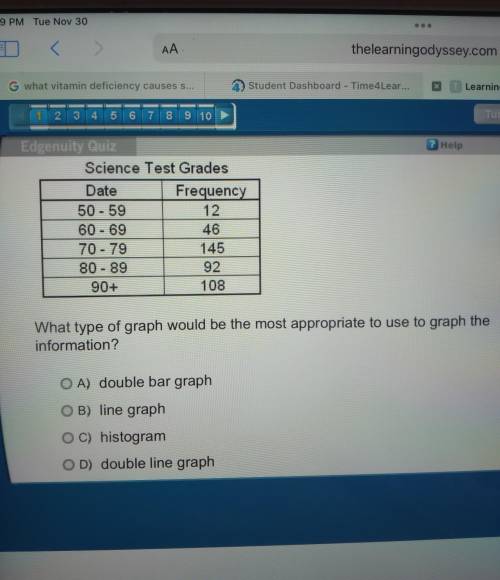
The survey below shows the science test grades from one state. Science Test Grades Date Frequency 50-59 12 60 - 69 46 70 - 79 145 80 - 89 92 90+ 108 - What type of graph would be the most appropriate to use to graph the information?

Answers: 3


Other questions on the subject: Mathematics
Mathematics, 21.06.2019 13:20, alexishenning
Using the graph below, select all statements that are true. a. f(0.6)=0 b. f(-3.2)=-3 c. f(5.1)=5 d. this is the graph of the greatest integer function. e. this graph is one-to-one.
Answers: 1
Mathematics, 21.06.2019 17:10, payshencec21
The number of chocolate chips in an 18-ounce bag of chocolate chip cookies is approximately normally distributed with a mean of 1252 chips and standard deviation 129 chips. (a) what is the probability that a randomly selected bag contains between 1100 and 1500 chocolate chips, inclusive? (b) what is the probability that a randomly selected bag contains fewer than 1125 chocolate chips? (c) what proportion of bags contains more than 1225 chocolate chips? (d) what is the percentile rank of a bag that contains 1425 chocolate chips?
Answers: 1
Mathematics, 21.06.2019 20:00, mercedespennewp72wea
Evaluate the discriminant of each equation. tell how many solutions each equation has and whether the solutions are real or imaginary. 4x^2 + 20x + 25 = 0
Answers: 2
You know the right answer?
The survey below shows the science test grades from one state. Science Test Grades Date Frequency 50...
Questions in other subjects:

Mathematics, 26.10.2020 23:40

History, 26.10.2020 23:40

Advanced Placement (AP), 26.10.2020 23:40
Mathematics, 26.10.2020 23:40


