
Mathematics, 30.11.2021 19:00 markpop
The graphs of f(x) = 3x − 2 and g(x) = 2(1.2)x are shown here. Select the table that correctly shows the most accurate approximate value of x for f(x) = g(x).


Answers: 1


Other questions on the subject: Mathematics
Mathematics, 21.06.2019 18:40, helpme6191
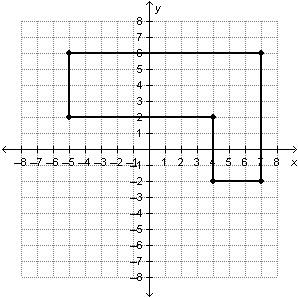
(mc 02.03) what set of reflections and rotations would carry rectangle abcd onto itself? reflect over the y-axis, reflect over the x-axis, rotate 180° rotate 180°, reflect over the x-axis, reflect over the line y=x reflect over the x-axis, rotate 180°, reflect over the x-axis rotate 180, reflect over the y-axis, reflect over the line y=x
Answers: 1
Mathematics, 21.06.2019 20:30, Courtneymorris19
Barney & noblet customers can choose to purchase a membership for $25 per year members receive 10% off all store purchases 1. how much would a member pay per year if he bought $50 worth of items each year? 2. write a slope-intercept equation that expresses how much a member pays per year using x to represent his purchases per year 3. how much would a member have to spend per year to pay off his membership fee?
Answers: 1
Mathematics, 21.06.2019 21:00, minasotpen1253
Awater tank holds 18000 gallons. how long will it take for the water level to reach 6000 gallons if the water is used at anaverage rate of 450 gallons per day
Answers: 1
Mathematics, 21.06.2019 23:30, ashiteru123
The average daily maximum temperature for laura’s hometown can be modeled by the function f(x)=4.5sin(πx/6)+11.8 , where f(x) is the temperature in °c and x is the month. x = 0 corresponds to january. what is the average daily maximum temperature in may? round to the nearest tenth of a degree if needed. use 3.14 for π .
Answers: 1
You know the right answer?
The graphs of f(x) = 3x − 2 and g(x) = 2(1.2)x are shown here. Select the table that correctly shows...
Questions in other subjects:


