
Mathematics, 30.11.2021 18:20 cielo2761
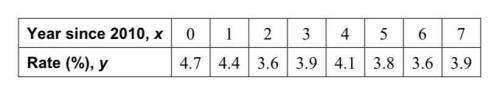
The table shows the mortgage interest rates y at a local bank for the years 2010 through 2017.
a. Make a scatter plot of the data.
b. Draw a line of best fit.
c. Write an equation of the line of best fit.
d. Interpret the slope of the line of best fit.
e. Assuming this trend continues, what would be the mortgage interest rate for the year 2020? Explain your reasoning.
f. Identify and interpret the correlation coefficient.

Answers: 2


Other questions on the subject: Mathematics
Mathematics, 21.06.2019 17:00, shayambros
How to solve a simultaneous equation involved with fractions?
Answers: 1
You know the right answer?
The table shows the mortgage interest rates y at a local bank for the years 2010 through 2017.
a....
Questions in other subjects:

Mathematics, 02.10.2019 20:10
Chemistry, 02.10.2019 20:10

Chemistry, 02.10.2019 20:10


