
Mathematics, 30.11.2021 14:00 LiannaMarquez542
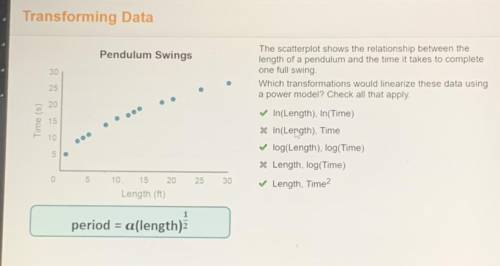
The scatterplot shows the relationship between the
length of a pendulum and the time it takes to complete
one full swing
Which transformations would linearize these data using
a power model? Check all that apply.
In(Length), In(Time)
* In(Lergth), Time
✓ log(Length), log(Time)
* Length, log(Time)
✓ Length, Time?
A C E

Answers: 2


Other questions on the subject: Mathematics
You know the right answer?
The scatterplot shows the relationship between the
length of a pendulum and the time it takes to c...
Questions in other subjects:

Business, 22.09.2021 22:50


Mathematics, 22.09.2021 22:50

Mathematics, 22.09.2021 22:50
Mathematics, 22.09.2021 22:50

Mathematics, 22.09.2021 22:50


