
Mathematics, 30.11.2021 04:10 superstarsara5ouh83x
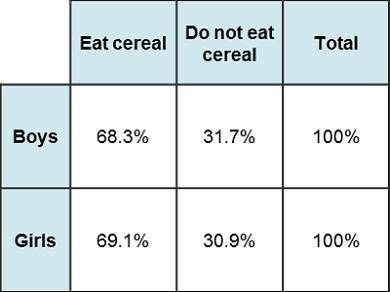
Relative Frequency Table by Rows
A 4-column table with 2 rows. Column 1 has entries boys, girls. Column 2 is labeled Eat cereal with entries 68.3 percent, 69.1 percent. Column 3 is labeled Do not eat cereal with entries 31.7 percent, 30.9 percent. Column 4 is labeled total with entries 100 percent, 100 percent.
What conclusion can you draw about the relative frequency of these results?
If you are a boy in this group, you are more likely not to eat cereal for breakfast than to eat cereal.
If you are a girl in this group, you are more likely to eat cereal for breakfast than not.
If you eat cereal for breakfast, you are a boy.
Knowing if a person eats cereal will help determine gender.

Answers: 2


Other questions on the subject: Mathematics
Mathematics, 21.06.2019 22:00, rhineharttori
Here is my question! jayne is studying urban planning and finds that her town is decreasing in population by 3% each year. the population of her town is changing by a constant rate. true or false?
Answers: 2
Mathematics, 21.06.2019 23:00, Nathaliasmiles
Charlie tosses five coins. what is the probability that all five coins will land tails up.
Answers: 2
Mathematics, 22.06.2019 00:00, rcmolyneaux
At a local museum, the total price for one adult and one child is $11. mrs. smith paid for herself and her three children. she spent $19. record the system of equations to be solved and then find the price of an adult and child ticket using either elimination or substitution.
Answers: 1
You know the right answer?
Relative Frequency Table by Rows
A 4-column table with 2 rows. Column 1 has entries boys, girls. C...
Questions in other subjects:
Mathematics, 19.01.2021 20:40

Geography, 19.01.2021 20:40


