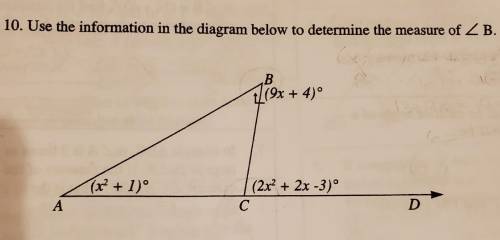
10. Use the information in the diagram below to determine the measure of < B.
...

Mathematics, 29.11.2021 03:00 yolo1143
10. Use the information in the diagram below to determine the measure of < B.

Answers: 1


Other questions on the subject: Mathematics
Mathematics, 21.06.2019 17:20, tfyfejeje1739
The function a represents the cost of manufacturing product a, in hundreds of dollars, and the function b represents the cost of manufacturing product b, in hundreds of dollars. a(t) = 5t + 2 b(t) = 7t - 2t +4 find the expression that describes the total cost of manufacturing both products, a(t) + b(t). a. 7t^2 - 7t + 2 b. 7t^2 + 3 +6 c. 7t^2 + 7t - 6 d. 7t^2 - 3t + 6
Answers: 3
Mathematics, 21.06.2019 20:40, selenamr
Formulate the indicated conclusion in nontechnical terms. be sure to address the original claim. the foundation chair for a hospital claims that the mean number of filled overnight beds is over 523, and she is therefore justified starting a funding campaign to add a wing to the hospital. assuming that a hypothesis test has been conducted and that the conclusion is failure to reject the null hypothesis, state the conclusion in nontechnical terms.
Answers: 3
Mathematics, 21.06.2019 23:10, kleighlamb4850
Which best describes the function on the graph? direct variation; k = −2 direct variation; k = -1/2 inverse variation; k = −2 inverse variation; k = -1/2
Answers: 2
Mathematics, 22.06.2019 00:00, bracefacer42
The data set represents the ages of players in a chess club. 27, 34, 38, 16, 22, 45, 54, 60. what is the mean absolute deviation of the data set?
Answers: 3
You know the right answer?
Questions in other subjects:

Social Studies, 15.03.2020 04:57

Chemistry, 15.03.2020 04:57
Mathematics, 15.03.2020 04:58

Mathematics, 15.03.2020 04:59

Mathematics, 15.03.2020 04:59

History, 15.03.2020 04:59


