Mathematics, 29.11.2021 01:40 luccim
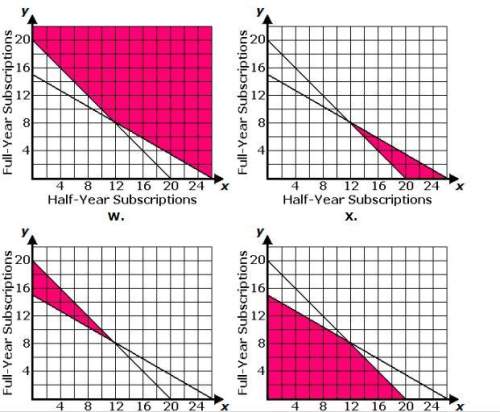
How can you use the graph of a linear equation to graph an inequality in two variables?
You can graph the related linear equation as a dashed or solid boundary line, and shade the appropriate containing the solutions to the inequality.
The blank can either be plane or half-plane

Answers: 1


Other questions on the subject: Mathematics

Mathematics, 21.06.2019 17:00, sophiawatson70
Line gh passes through points (2, 5) and (6, 9). which equation represents line gh? y = x + 3 y = x – 3 y = 3x + 3 y = 3x – 3
Answers: 1

Mathematics, 21.06.2019 21:30, allendraven89pds755
Which equation is true? i. 56 ÷ 4·7 = 82 ÷ (11 + 5) ii. (24 ÷ 8 + 2)3 = (42 + 9)2 neither i nor ii ii only i and ii i only
Answers: 1

Mathematics, 21.06.2019 21:30, jarviantemelton
Consider the following equation. 1/2x^3+x-7=-3sqrtx-1 approximate the solution to the equation using three iterations of successive approximation. use the graph below as a starting point. a. b. c. d.
Answers: 3
You know the right answer?
How can you use the graph of a linear equation to graph an inequality in two variables?
You can gr...
Questions in other subjects:

Mathematics, 12.11.2020 01:50


Mathematics, 12.11.2020 01:50

Arts, 12.11.2020 01:50

Mathematics, 12.11.2020 01:50


Spanish, 12.11.2020 01:50


