
Mathematics, 28.11.2021 21:00 ewalchloe5067920
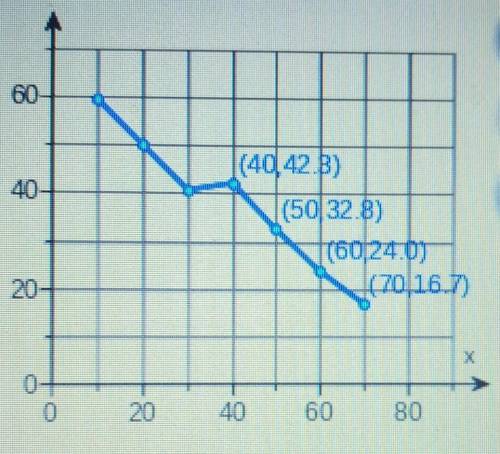
The graph on the right shows the remaining life expectancy in years for female of h x find the average rate of change between the ages of 50 and 60 describe what the average rate of change means in the situation the average rate of change of life expectancy between the ages of 50 and 60 is .
(type an integer or a decimal)

Answers: 3


Other questions on the subject: Mathematics
Mathematics, 21.06.2019 22:30, Edwardwall
What three-dimensional solid have 6 rectangular faces, 2 equal bases that are not rectangles and 18 edges
Answers: 3
Mathematics, 21.06.2019 23:30, aherrerasmile1
Scenario: a rectangular plot of ground is 5 meters longer than it is wide. its area is 20,000 square meters. question: what equation will you find the dimensions? note: let w represent the width. options: w(w+5)=20,000 w^2=20,000+5 (w(w+5))/2=20,000 w+2(w+5)=20,000
Answers: 1
You know the right answer?
The graph on the right shows the remaining life expectancy in years for female of h x find the avera...
Questions in other subjects:

Mathematics, 14.02.2020 00:32


Mathematics, 14.02.2020 00:52
Mathematics, 14.02.2020 00:52


