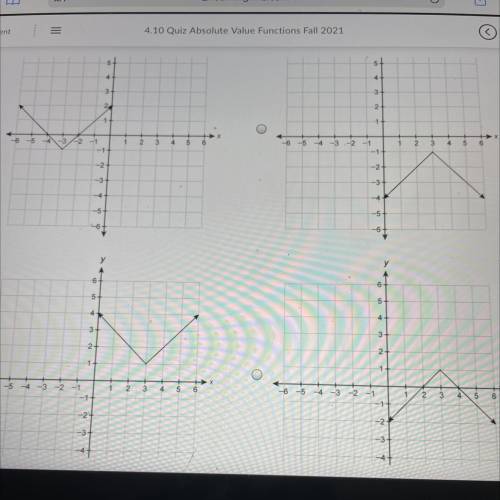
Which graph represents the function f (x) = –| x - 3| + 1
...

Mathematics, 28.11.2021 06:00 janaemartinez42
Which graph represents the function f (x) = –| x - 3| + 1

Answers: 1


Other questions on the subject: Mathematics
Mathematics, 21.06.2019 16:30, robclark128
You are updating your garage and the only thing left to paint is your garage day. you're only going to paint the slide that faces the street. the garage door is 9 fert 8inches tall and 120 inches wide. you need to know the surface area of the side of the garage door to determine how much paint to buy. the hardware store sells paint by how much covers a square foot. what is the surface area you should report to the hardware store what is the answer
Answers: 3
Mathematics, 21.06.2019 21:10, samiam61
Which question is not a good survey question? a. don't you agree that the financial crisis is essentially over? 63on average, how many hours do you sleep per day? c. what is your opinion of educational funding this year? d. are you happy with the availability of electronic products in your state?
Answers: 2
You know the right answer?
Questions in other subjects:

Social Studies, 17.10.2019 10:50


Health, 17.10.2019 10:50

Chemistry, 17.10.2019 10:50

Mathematics, 17.10.2019 10:50
Mathematics, 17.10.2019 10:50


