
Mathematics, 27.11.2021 03:40 destinyd10189
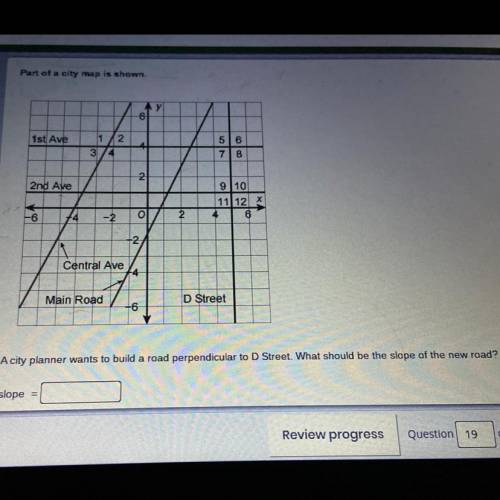
A city planner wants to build a road perpendicular to D Street. What should be the slope of the new road?

Answers: 1


Other questions on the subject: Mathematics
Mathematics, 21.06.2019 18:00, TGJuuzouSuzuya
!! 10 ! a westbound jet leaves central airport traveling 635 miles per hour. at the same time, an eastbound plane departs at 325 miles per hour. in how many hours will the planes be 1900 miles apart?
Answers: 1
Mathematics, 21.06.2019 21:30, shymitch32
Create a graph for the demand for starfish using the following data table: quantity/price of starfish quantity (x axis) of starfish in dozens price (y axis) of starfish per dozen 0 8 2 6 3 5 5 2 7 1 9 0 is the relationship between the price of starfish and the quantity demanded inverse or direct? why? how many dozens of starfish are demanded at a price of five? calculate the slope of the line between the prices of 6 (quantity of 2) and 1 (quantity of 7) per dozen. describe the line when there is a direct relationship between price and quantity.
Answers: 3
Mathematics, 21.06.2019 23:30, DesperatforanA
Tim earns $120 plus $30 for each lawn he mows. write an iniqualityvto represent how many lawns he needs to mow to make more than $310
Answers: 2
Mathematics, 22.06.2019 02:30, misk980
Atrain traveled for 1.5 hours to the first station, stopped for 30 minutes, then traveled for 4 hours to the final station where it stopped for 1 hour. the total distance traveled is a function of time. which graph most accurately represents this scenario? a graph is shown with the x-axis labeled time (in hours) and the y-axis labeled total distance (in miles). the line begins at the origin and moves upward for 1.5 hours. the line then continues upward at a slow rate until 2 hours. from 2 to 6 hours, the line continues quickly upward. from 6 to 7 hours, it moves downward until it touches the x-axis a graph is shown with the axis labeled time (in hours) and the y axis labeled total distance (in miles). a line is shown beginning at the origin. the line moves upward until 1.5 hours, then is a horizontal line until 2 hours. the line moves quickly upward again until 6 hours, and then is horizontal until 7 hours a graph is shown with the axis labeled time (in hours) and the y-axis labeled total distance (in miles). the line begins at the y-axis where y equals 125. it is horizontal until 1.5 hours, then moves downward until 2 hours where it touches the x-axis. the line moves upward until 6 hours and then moves downward until 7 hours where it touches the x-axis a graph is shown with the axis labeled time (in hours) and the y-axis labeled total distance (in miles). the line begins at y equals 125 and is horizontal for 1.5 hours. the line moves downward until 2 hours, then back up until 5.5 hours. the line is horizontal from 5.5 to 7 hours
Answers: 1
You know the right answer?
A city planner wants to build a road perpendicular to D Street. What should be the slope of the new...
Questions in other subjects:
Mathematics, 07.02.2022 21:40


Mathematics, 07.02.2022 21:40

Geography, 07.02.2022 21:40


