
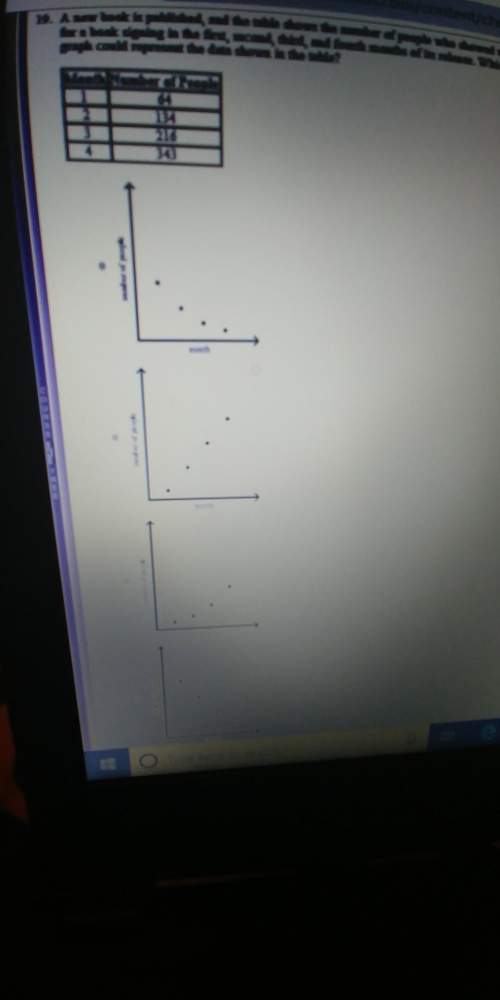
Mathematics, 25.11.2021 08:20 biancatay
The box plots show the student grades on a chapter test compared to the grades on a retest in the same class.
Box plots titled Chapter Test versus Retest with horizontal axis labeled Class Marks ranges from 0 to 100. Chapter Test box plot with minimum approximately at 50 and maximum approximately at 100 has interquartile ranges approximately between 50 and 70 and median approximately between 60 and 70. Retest box plot with minimum approximately between 40 and 50 and maximum approximately between 90 and 100 has interquartile ranges approximately between 50 and 80 and median approximately between 60 and 70.
Which of the following best describes the information about the medians?

Answers: 2


Other questions on the subject: Mathematics
Mathematics, 20.06.2019 18:04, demarley3093
The expression 42 plus 57 shows how much money nate spent at a store .which expression also shows how much money nate spend
Answers: 1
Mathematics, 21.06.2019 14:30, thnguyen0720
Find all the values of x that make 0.1x + 0.25(102 - x) < 17.10 true.
Answers: 1
Mathematics, 21.06.2019 14:30, serenityburke
Acommunity group sells 2,000 tickets for its raffle. the grand prize is a car. neil and 9 of his friends buy 10 tickets each. when the winning ticket number is announced, it is found to belong to neil's group. given this information, what is the probability that the ticket belongs to neil? a.1/5 b.1/10 c.1/200 d.1/4
Answers: 2
Mathematics, 22.06.2019 01:00, s27511583
The weight of 46 new patients of a clinic from the year 2018 are recorded and listed below. construct a frequency distribution, using 7 classes. then, draw a histogram, a frequency polygon, and an ogive for the data, using the relative information from the frequency table for each of the graphs. describe the shape of the histogram. data set: 130 192 145 97 100 122 210 132 107 95 210 128 193 208 118 196 130 178 187 240 90 126 98 194 115 212 110 225 187 133 220 218 110 104 201 120 183 124 261 270 108 160 203 210 191 180 1) complete the frequency distribution table below (add as many rows as needed): - class limits - class boundaries - midpoint - frequency - cumulative frequency 2) histogram 3) frequency polygon 4) ogive
Answers: 1
You know the right answer?
The box plots show the student grades on a chapter test compared to the grades on a retest in the sa...
Questions in other subjects:
Mathematics, 24.07.2020 01:01
Mathematics, 24.07.2020 01:01


Biology, 24.07.2020 01:01

Mathematics, 24.07.2020 01:01


