
Mathematics, 25.11.2021 05:30 sandy701
Please hellp
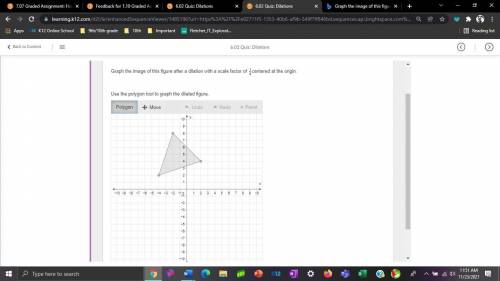
Graph the image of this figure after a dilation with a scale factor of 12centered at the origin.
Use the polygon tool to graph the dilated figure.


Answers: 2


Other questions on the subject: Mathematics
Mathematics, 21.06.2019 12:50, xojade
Plz, ! the box plot below shows the total amount of time, in minutes, the students of a class surf the internet every day: a box plot is shown. part a: list two pieces of information that are provided by the graph and one piece of information that is not provided by the graph. (4 points) part b: calculate the interquartile range of the data, and explain in a sentence or two what it represents. (4 points) part c: explain what affect, if any, there will be if an outlier is present. (2 points)
Answers: 3
Mathematics, 21.06.2019 20:40, jaydenrobinettewca
Ineed someone to me answer my question i have to have this done and knocked out
Answers: 2
Mathematics, 21.06.2019 21:30, kyandrewilliams1
Alcoa was $10.02 a share yesterday. today it is at $9.75 a share. if you own 50 shares, did ou have capital gain or loss ? how much of a gain or loss did you have ? express the capital gain/loss as a percent of the original price
Answers: 2
Mathematics, 21.06.2019 23:00, darrell1168
How many 2/5s are in 1 and 1/2 plz someone me right now
Answers: 1
You know the right answer?
Please hellp
Graph the image of this figure after a dilation with a scale factor of 12centered at...
Questions in other subjects:


Health, 21.04.2020 19:30

Mathematics, 21.04.2020 19:30
Mathematics, 21.04.2020 19:30


