What equation is graphed in this figure?
A: y−3=32(x+1)
B: y+1=−23(x−3)
C:...

Mathematics, 24.11.2021 19:00 nataliamontirl8152
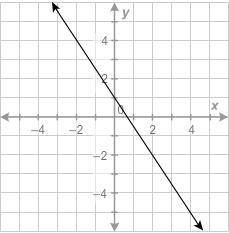
What equation is graphed in this figure?
A: y−3=32(x+1)
B: y+1=−23(x−3)
C: y−4=−23(x+2)
D: y+2=−32(x−2)

Answers: 2


Other questions on the subject: Mathematics
Mathematics, 21.06.2019 12:40, lorelaistudent
An appliance salesman sets a goal to sell an average of 6 appliances per day for the first two weeks of his new job. the dot plot shows the number he sold each day during the first 13 days. what is the minimum number of appliances he must sell on the 14th day in order to reach his goal? a) 5 b) 6 c) 7 d) 8
Answers: 1
Mathematics, 21.06.2019 23:30, Littllesue2
Find the measure of angle y. round your answer to the nearest hundredth. ( type the numerical answer only) a right triangle is shown with one leg measuring 5 and another leg measuring 14. an angle across from the leg measuring 5 is marked y degrees. numerical answers expected!
Answers: 1
Mathematics, 21.06.2019 23:30, Kayteeortiz4593
Can someone me with my math problem pls my teacher is on my back about this
Answers: 2
You know the right answer?
Questions in other subjects:

Mathematics, 28.05.2020 13:59
Mathematics, 28.05.2020 13:59
Mathematics, 28.05.2020 13:59
Mathematics, 28.05.2020 13:59

Biology, 28.05.2020 13:59


