
Mathematics, 24.11.2021 08:10 Daisy5219
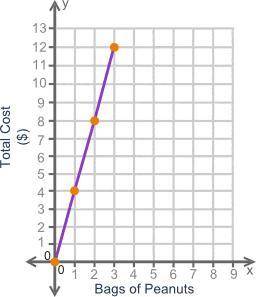
The graph shows the amount of money paid when purchasing bags of peanuts at the zoo:
A graph is shown. The x-axis is labeled from 0 to 9. The y-axis is labeled from 0 to 13. The four points shown on the graph are ordered pairs 0, 0 and 1, 4 and 2, 8 and 3, 12. These points are joined by a line. The label on the x-axis is Bags of peanuts. The title on the y-axis is Total cost in dollars.
Write an equation to represent the relationship between the total cost (y) and the number of bags of peanuts (x).
y = 4x
y = one-fourth x
y = 3x
y = one-third x

Answers: 3


Other questions on the subject: Mathematics
Mathematics, 21.06.2019 19:00, gabbytopper8373
Identify the type of observational study described. a statistical analyst obtains data about ankle injuries by examining a hospital's records from the past 3 years. cross-sectional retrospective prospective
Answers: 2
Mathematics, 21.06.2019 20:30, jmcd10
Create a question with this scenario you could ask that could be answered only by graphing or using logarithm. david estimated he had about 20 fish in his pond. a year later, there were about 1.5 times as many fish. the year after that, the number of fish increased by a factor of 1.5 again. the number of fish is modeled by f(x)=20(1.5)^x.
Answers: 1
You know the right answer?
The graph shows the amount of money paid when purchasing bags of peanuts at the zoo:
A graph is sh...
Questions in other subjects:
Mathematics, 23.05.2021 05:30

World Languages, 23.05.2021 05:30
Mathematics, 23.05.2021 05:30


