
7.
Which equation is represented by the graph?
A. y = −x2 + 2
B. y = 2x2 −...

Mathematics, 20.11.2021 14:00 jweldene12
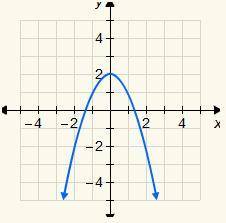
7.
Which equation is represented by the graph?
A. y = −x2 + 2
B. y = 2x2 − 1
C. y = x2 + 2
D. y = −2x2 − 1

Answers: 2


Other questions on the subject: Mathematics
Mathematics, 21.06.2019 18:00, tmrsavage02p7cj16
Ageologist had two rocks on a scale that weighed 4.6 kilograms together. rock a was 0.5 of the total weight. how much did rock a weigh?
Answers: 1
Mathematics, 22.06.2019 02:10, netflixacc0107
The human resources manager at a company records the length, in hours, of one shift at work, x. he creates the probability distribution below. what is the probability that a worker chosen at random works at least 8 hours? 0.62 0.78 0.84 0.96
Answers: 2
You know the right answer?
Questions in other subjects:

Biology, 25.11.2019 12:31


History, 25.11.2019 12:31

Chemistry, 25.11.2019 12:31
English, 25.11.2019 12:31
Mathematics, 25.11.2019 12:31
Mathematics, 25.11.2019 12:31


