
Mathematics, 20.11.2021 07:40 ajayrose
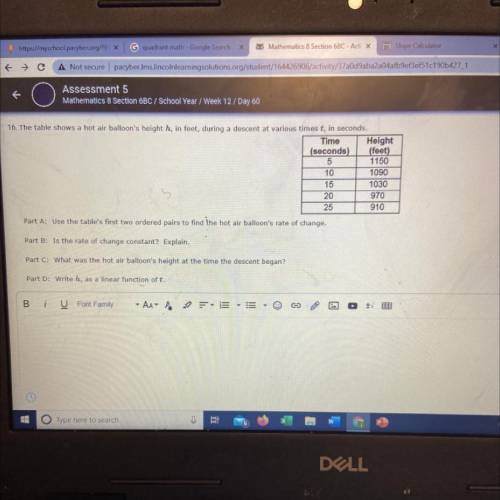
16. The table shows a hot air balloon's height h, in feet, during a descent at various times t, in seconds.
Time Height
(seconds) (feet)
5
1150
10
1090
15
1030
20
970
25
910
Part A: Use the table's first two ordered pairs to find the hot air balloon's rate of change.
Part B: Is the rate of change constant? Explain.
Part C: What was the hot air balloon's height at the time the descent began?
Part D: Write h, as a linear function of t.

Answers: 1


Other questions on the subject: Mathematics
Mathematics, 22.06.2019 01:30, deshawnnash53
Becca wants to mix fruit juice and soda to make a punch. she can buy fruit juice for $3 a gallon and soda for $4 a gallon. if she wants to make 28 gallons of punch at a cost of $3.25 a gallon, how many gallons of fruit juice and how many gallons of soda should she buy?
Answers: 2
Mathematics, 22.06.2019 01:50, vorhees2406
If jklm is a trapezoid, which statements must be true?
Answers: 1
Mathematics, 22.06.2019 03:00, dominiqueallen23
Describe how the presence of possible outliers might be identified on the following. (a) histograms gap between the first bar and the rest of bars or between the last bar and the rest of bars large group of bars to the left or right of a gap higher center bar than surrounding bars gap around the center of the histogram higher far left or right bar than surrounding bars (b) dotplots large gap around the center of the data large gap between data on the far left side or the far right side and the rest of the data large groups of data to the left or right of a gap large group of data in the center of the dotplot large group of data on the left or right of the dotplot (c) stem-and-leaf displays several empty stems in the center of the stem-and-leaf display large group of data in stems on one of the far sides of the stem-and-leaf display large group of data near a gap several empty stems after stem including the lowest values or before stem including the highest values large group of data in the center stems (d) box-and-whisker plots data within the fences placed at q1 â’ 1.5(iqr) and at q3 + 1.5(iqr) data beyond the fences placed at q1 â’ 2(iqr) and at q3 + 2(iqr) data within the fences placed at q1 â’ 2(iqr) and at q3 + 2(iqr) data beyond the fences placed at q1 â’ 1.5(iqr) and at q3 + 1.5(iqr) data beyond the fences placed at q1 â’ 1(iqr) and at q3 + 1(iqr)
Answers: 1
You know the right answer?
16. The table shows a hot air balloon's height h, in feet, during a descent at various times t, in s...
Questions in other subjects:


English, 08.04.2020 18:48


